
Takeaways
- Fort Hood inventory falls under 5 months, creeping toward a Seller’s Market
- The rebounding fourplex/duplex market has plateaued
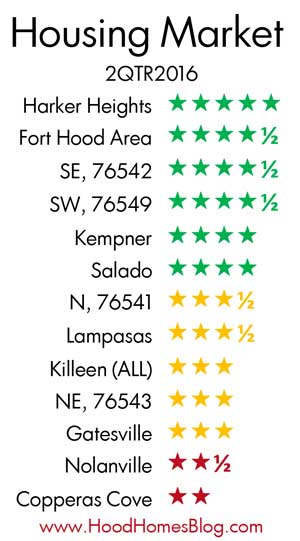
- The Harker Heights housing market continues to be one of the best performing communities
Housing Inventory Falls Under 5 Months
The Fort Hood area behaves like a weak buyer’s market – sellers often pay closing costs, title policies, surveys, home warranties and more. Buyer’s markets are usually defined as 6+ months of inventory, however the Fort Hood area is now under 5 months. If this keeps up, or gets lower, sellers may be able to get more from buyers in the near future.
Copperas Cove followed up a great 1st Quarter showing with a lousy 2nd Quarter, likely just the ebbs and flows of a market (and small data sample size). Harker Heights did well, the only region to improve in all metrics over the same period in 2015.
Meanwhile, 2-4 unit multi-families continue to show signs that the rebound has run its course. Prices skyrocketed since the dregs of 2011, but couldn’t go up forever.
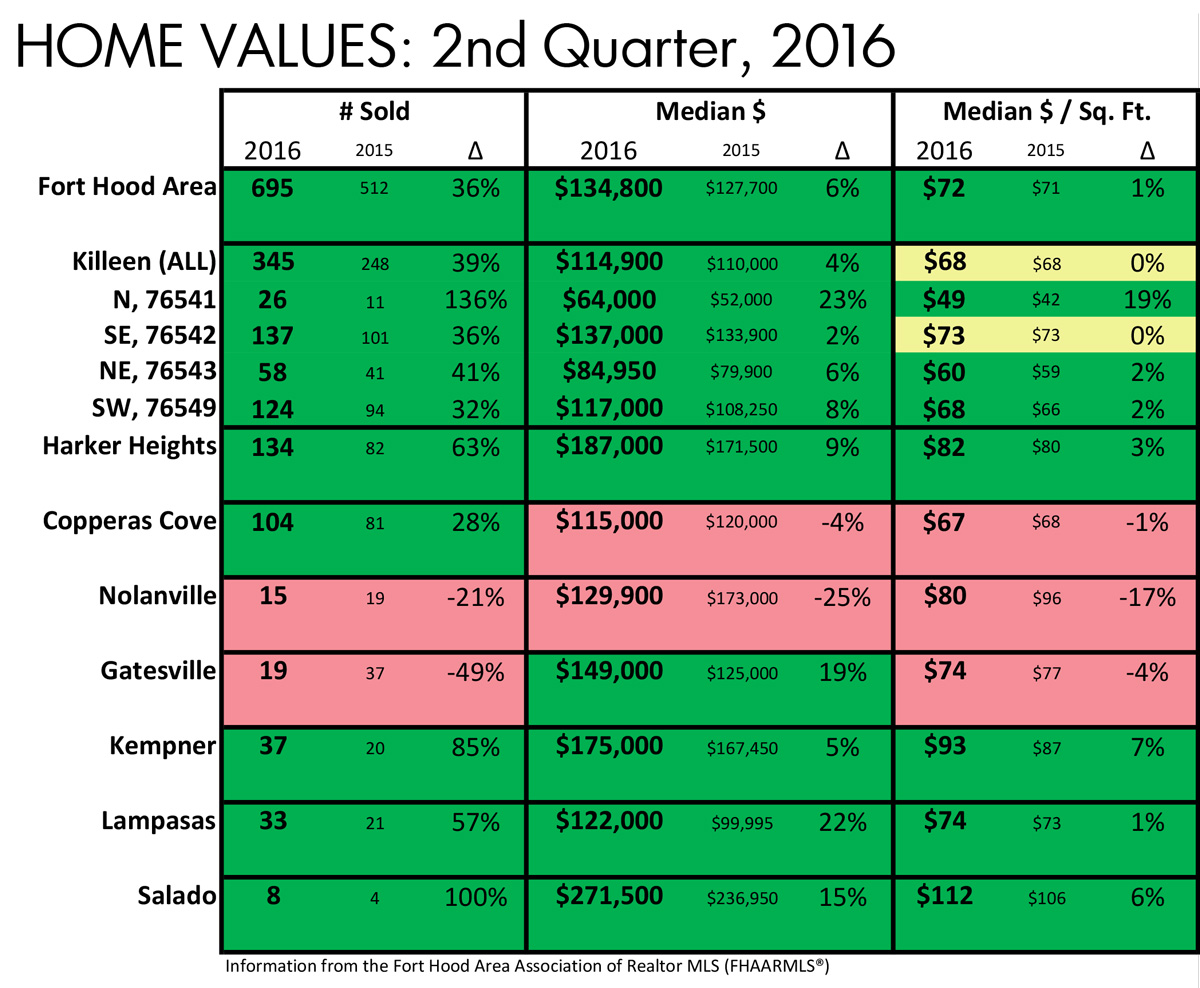
Home Values
While the 2nd Quarter is not great news for all communities, the Fort Hood market as a whole had a very good three months. Absorption rates dropping was just part of the fun. The entire area saw a YoY increase in the median home value of 6%.
Heights’ Heights
Harker Heights is one of the best performing communities and fastest growing – seeing a 63% increase in home sales versus the same period in 2015, as well as nearly a double digit price increase.
Sample Size
The small sample size for many communities will mean increased volatility in many of these numbers over as short a span as 3 months.
Tumbleweed Estates vs. Nolanridge
Nolanville’s numbers look awful bad on the surface for a second quarter in a row, again because the area has a bit of a chasm between homes in the $120ks and down and the $180ks and up.
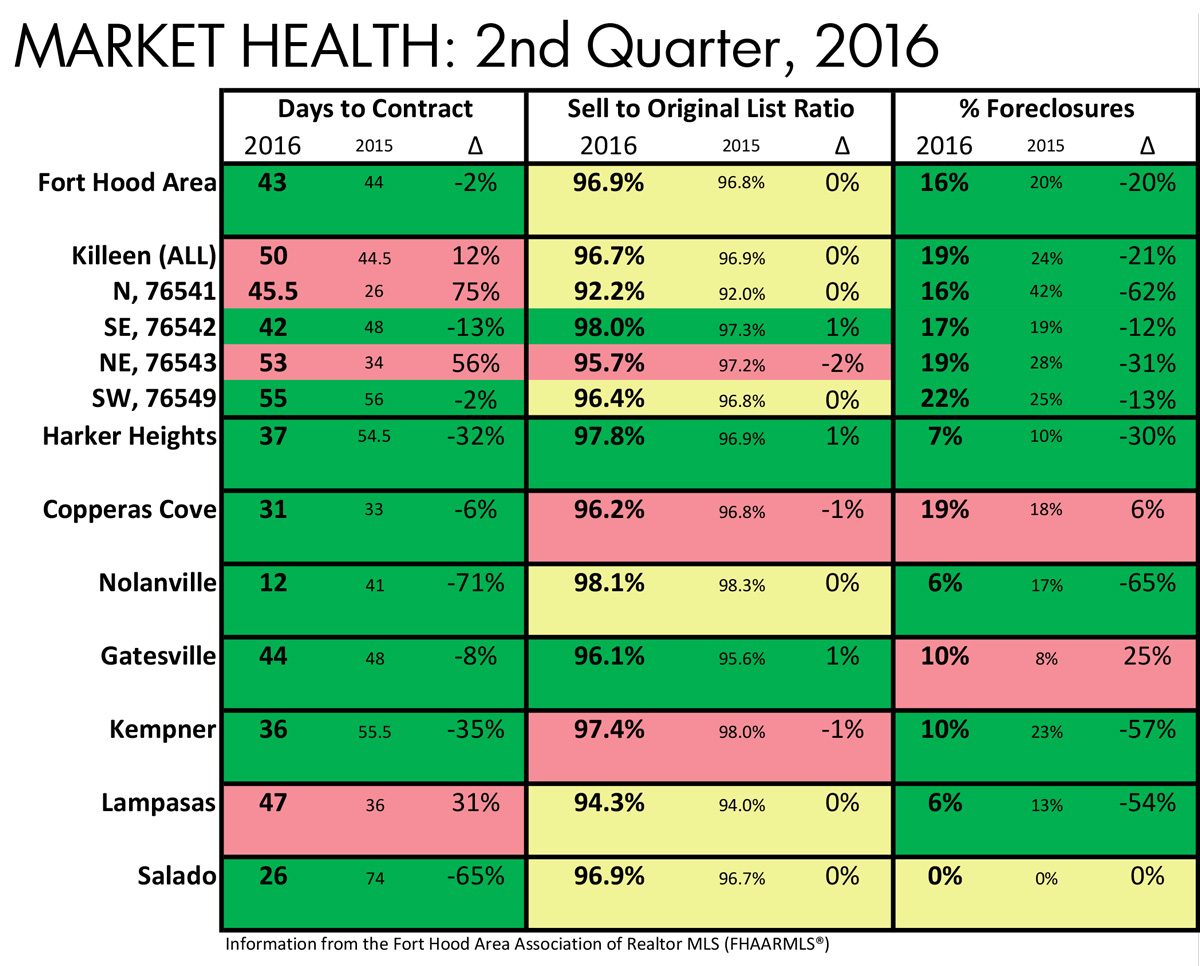
Foreclosures
Because of builders and the VA loan, foreclosures are always likely to be prevalent features of the Fort Hood housing landscape, and generally hover around a constant 20% of the MLS sales. The modest 1st Quarter drops are now dramatic decreases – a great sign for the market.
Are People Getting Excited?
The Sell to Original List Ratio column is the only one in this report without much green. Seller’s aren’t getting any closer to asking price. It may be a case of optimism in the market and pricing aggressively. If so, it hasn’t hurt the days on market any, as sellers in most areas are finding their buyers quicker than this time last year.
Workhorse
The South sides of Killeen (76549 and 76542) didn’t have a splashy 2nd Quarter like Harker Heights did, but certainly an all-around good effort with solid numbers throughout. This is likely driven in the SE side by higher end neighborhoods that continue going up in place like White Rock Estates and Yowell Ranch, and in the SW side from extensive commercial development along Stan Schlueter.
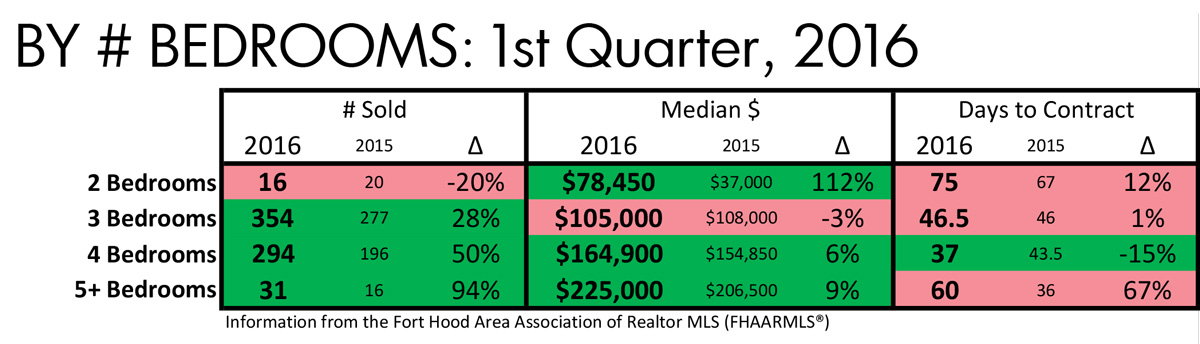
Bedrooms are an abundant commodity in the Fort Hood area. 3 and 4 bedroom homes are normal. Sellers and landlords with only 2 bedroom homes face strong headwinds, though the 16 two-bedroom homes that sold this quarter did a lot better than they did a year ago. Interestingly, all but 4 bedroom homes suffered a longer time on the market, meaning that 4 bedroom homes are probably the sweet spot when it comes to selling in the Fort Hood area.
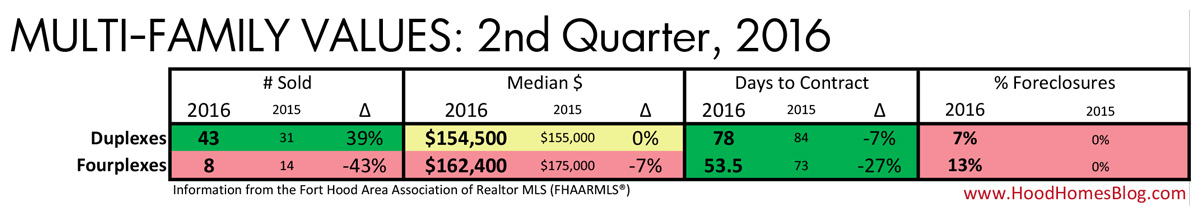
The multi-family market had been doing well, rebounding from the lows of the recession and 2011 bottom. However they couldn’t keep going up forever. It looks as though the momentum has, at best, stalled. At worst, we’ve reached the plateau and won’t see significant price increases until rents start creeping upwards.
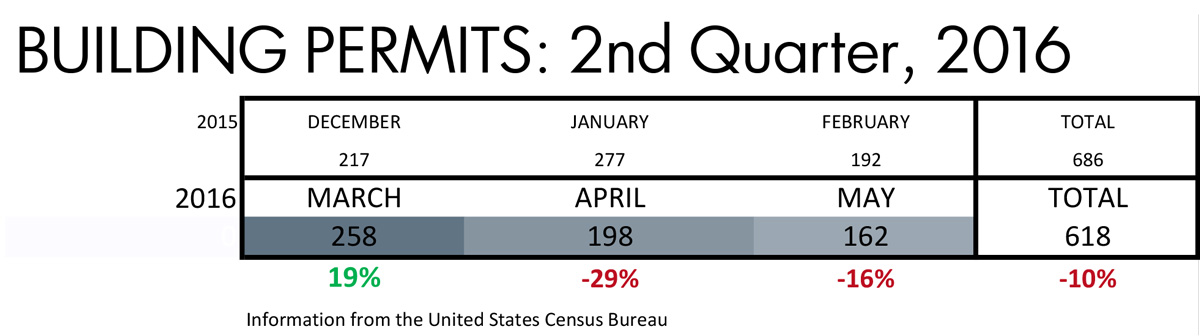
Permits overall are down for the same period in 2015. It may be a case that developers usually get their permits done early in the year with deadlines in October or December. It may also simply be the case that Fort Hood residential development is slowing down, which may not hold up if inventory keeps falling.
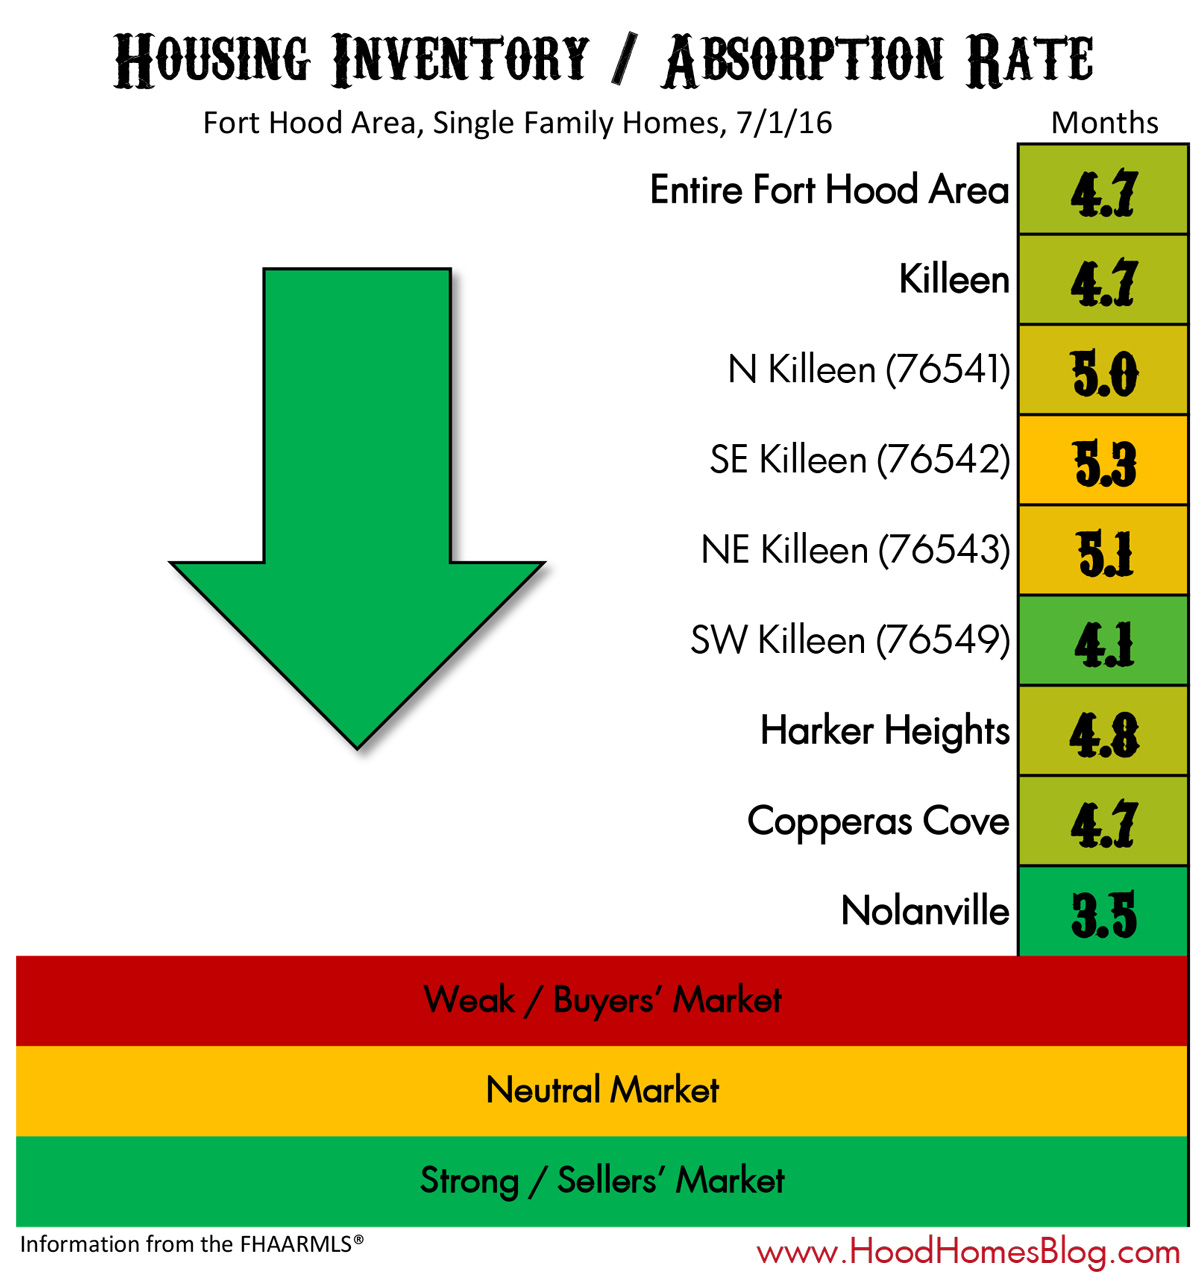
Did you feel bad for Nolanville, who got clobbered in nearly every other metric? Well, don’t. Those metrics measure “direction” – as in, whether a market is getting better or worse versus where it was a year ago. Nolanville has gotten “worse” so to speak, but only because it has been such a strong market. 3.5 months inventory is closer to what white hot markets like Austin or Georgetown see (closer – not quite there, yet).
These are numbers not generally associated with a buyers’ market like Fort Hood. There are various reasons Fort Hood still behaves like a buyer’s market, but no reason that will be the case forever. If inventory dips below 4, and especially below 3, I predict buyers will start paying their own closing costs more often.
Conclusion
The trends are consistent with a market that is growing at a moderate, healthy rate. While some communities may not like all the numbers they see, some of that may just be the noise of small sample sizes and the seasonal market. It would take a couple sustained quarters of disappointing results to worry in places like Copperas Cove.
And of course, this is all very general information. If you are interested in knowing more about the value of your home and the trends in your specific neighborhoods, contact me about a home valuation!