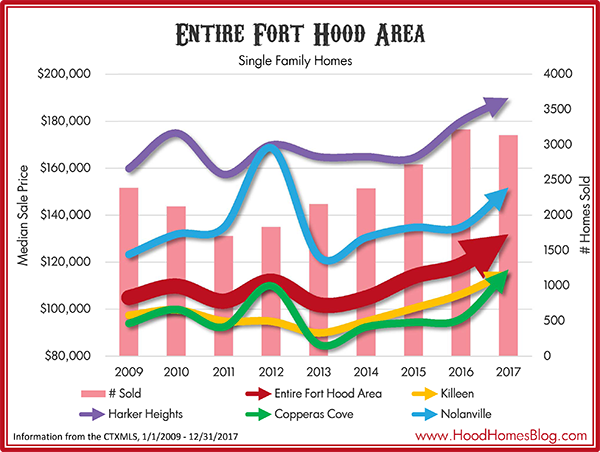
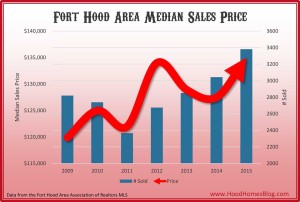
Median Price
The Fort Hood area median price climbed from $118,950 to $132,000 in 2017 (including foreclosure sales), a striking 11% growth. That was with slightly fewer sales than in 2016 with approximately 3137 total non-builder MLS sales. Every city in the Fort Hood area saw benefits, with median prices rising across the board, with incredible 21.9% growth in Copperas Cove, seeing its median price just eclipse Killeen.
- Killeen – $116,000, 8.9%
- Harker Heights – $189,900, 5.5%
- Copperas Cove – $117,000, 21.9%
- Nolanville – $151,875, 12.5%
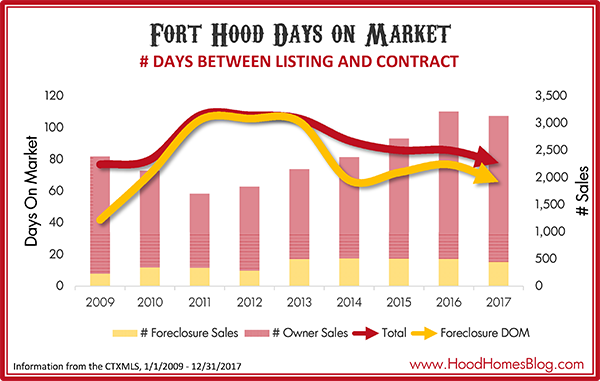
Days on Market
Median days on market dropped slightly from 2016 to 78 days (from listing to closing), down from 86 in 2016. Foreclosures sell slightly more quickly.
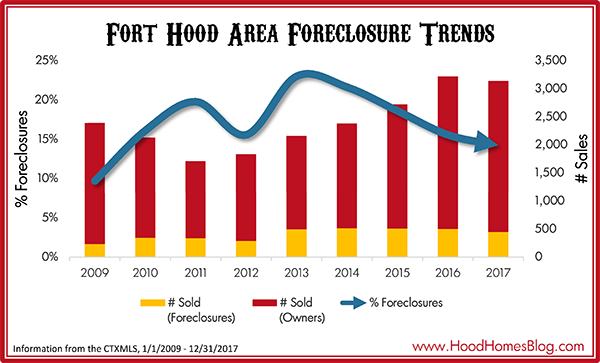
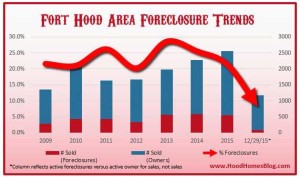
Foreclosures
The Fort Hood area survived the Great Recession reasonably well versus other markets in America. But foreclosures as a percentage of the market were still considerable. Foreclosures fell slightly from 507 total sales in 2016 to 447 sales in 2017, for 14.2% of Fort Hood area sales, the lowest percentage of sales since 2009. This drop in foreclosures is partly responsible for the rising area prices. Even median foreclosure prices rose from $80,000 in 2016 to $90,000 in 2017.
The worst year for area foreclosures was 2013, with 497 foreclosure sales, but those comprised 23% of Fort Hood sales.
Foreclosures are a consistent feature of the Fort Hood market, even while growing, due to a variety of factors including the prevalence of the VA loan.
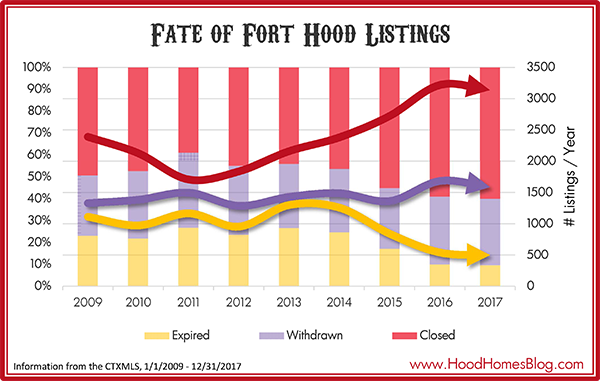
Listing Result
60% of listings ended with a closing in 2017, an all-time high for the Fort Hood area through 2009 (2016 was 59%). 30% were withdrawn and 10% expired.
Some homes that withdrew or expired may have sold later in the year and may be counted multiple times.
Expired listings are those that go their full listing term without selling, usually 6 months. Expireds are at an all-time low after comprising 37% of listings in 2013 and 2011, with only 500 listings expiring in 2017.
Withdrawn listings are down from 31% of listings to 30%. Withdrawn listing include those that were pulled from the market because the home rented before it sold. Any other reason a seller pulls their home off the market prior to the expiration of the listing agreement results in a Withdrawn status.
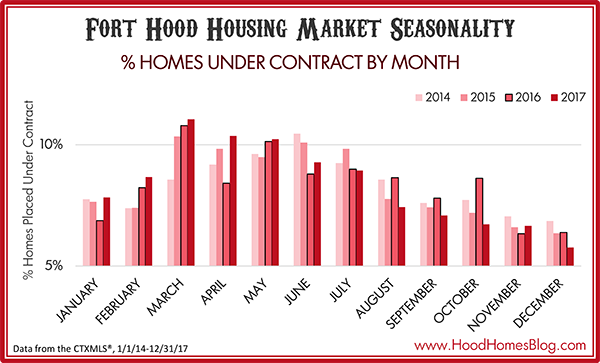
Seasonality
March is hot-hot-hot! This is a graph not of closings by month, but contracts by month. After all, the closing is a result of a contract, not the other way around. You want you home on the market when buyers are making offers, not closing on other peoples’ homes.
Another big question about Fort Hood are the military PCS and deployment cycles and how those impact the market. You can see there are a few outliers that might be explained by a military rotation – October of 2016 or April of 2017 were unusually hot months. But for the most part, the first six months of the year is when most of the action happens, and it’s probably not useful to worry too much about timing the season.
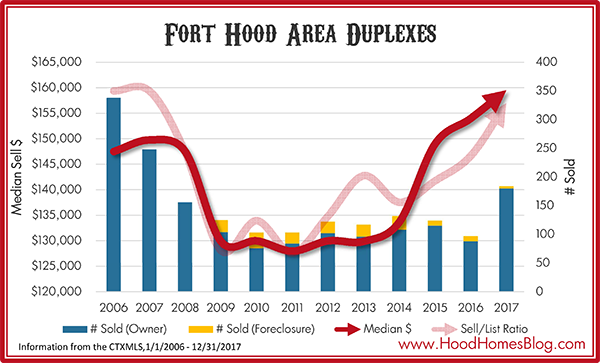
Duplexes
Like fourplexes, duplexes were impacted by the Great Recession, but not nearly as severely. That is because duplex owners are more likely to be owner-occupants, locals, or military investors who didn’t get caught with their pants down by the housing crash.
Duplex numbers have rebounded nicely, with a median price of $159,550 in 2017 and significantly more duplexes selling in 2017 than 2016, partly due to a significant uptick in builder duplex activity.
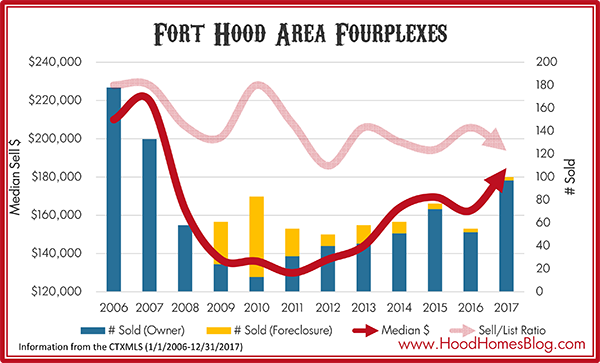
Fourplexes
The Fourplex market had an excellent 2017, with the median sales price rising over $20,000, a 14% increase over 2016, to $184,700. From my own observation and experiences, most of that improvement took place with sales in the second half of 2017, suggesting the median price will be yet higher in 2018.
The fourplex market is fairly dramatic as the graph shows. 4/5 fourplexes in 2010 were foreclosures, with the median price bottoming out at $129,900 in 2011. That was due to the Great Recession. Many fourplex owners were out-of-state investors caught in firesales. Even though the Killeen market weathered the storm reasonably well, the fourplex market crashed. Those who could hold on did well, as rents were mostly unaffected. There have been no new fourplexes built since 2008.
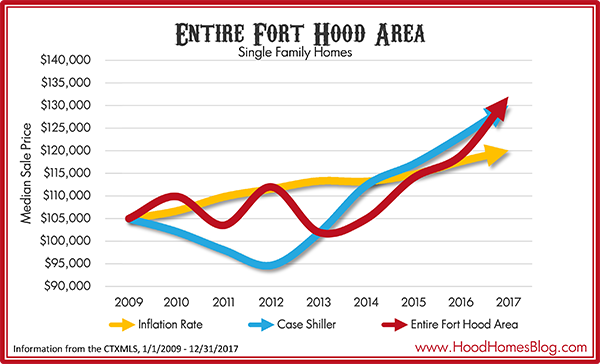
Fort Hood vs. Inflation and Case-Shiller
Fort Hood has performed well versus inflation and kept up with the national home price trends since 2009, seeing it’s strongest growth in 2016 and 2017.
| Fort Hood Area | Inflation | Case-Shiller Index |
|---|---|---|
| 2.90% | 1.69% | 2.71% |
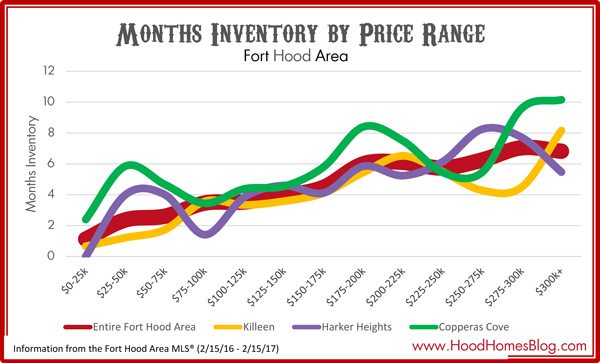
Months Inventory by Price Point
One the whole, there are not any major inventory spikes or dips. And inventory for the entire three cities was a bullish 4.2 months – continuing to decline and point toward a more seller friendly market.
| Entire Fort Hood Area | Killeen | Copperas Cove | Harker Heights | |
|---|---|---|---|---|
| Inventory (2/16/17) | 4.2 | 3.6 | 5.2 | 5.3 |
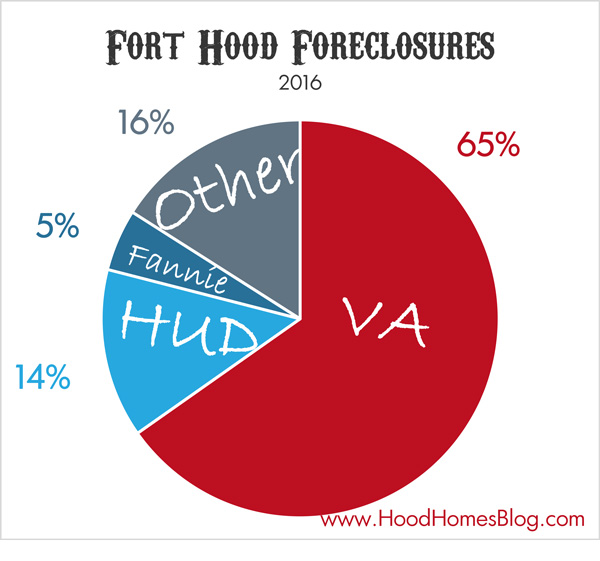
Foreclosure Composition
Unique to the Fort Hood market is the tremendous number of VA foreclosures. In fact, over 60% of foreclosures in our market are VA foreclosures.
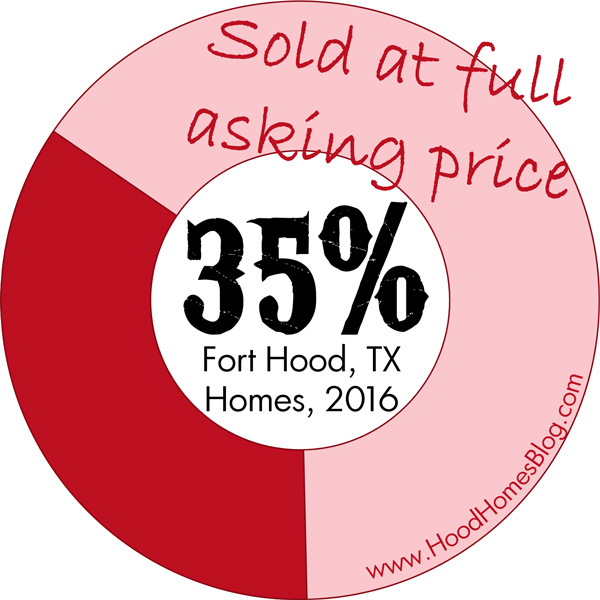
Sold at Full Asking Price or Better
A well priced and marketed home can get a full price offer in our market, and often does. Of the 3438 homes that sold so far in 2016 on the Fort Hood MLS, 1212 (35%) sold at full price or higher.
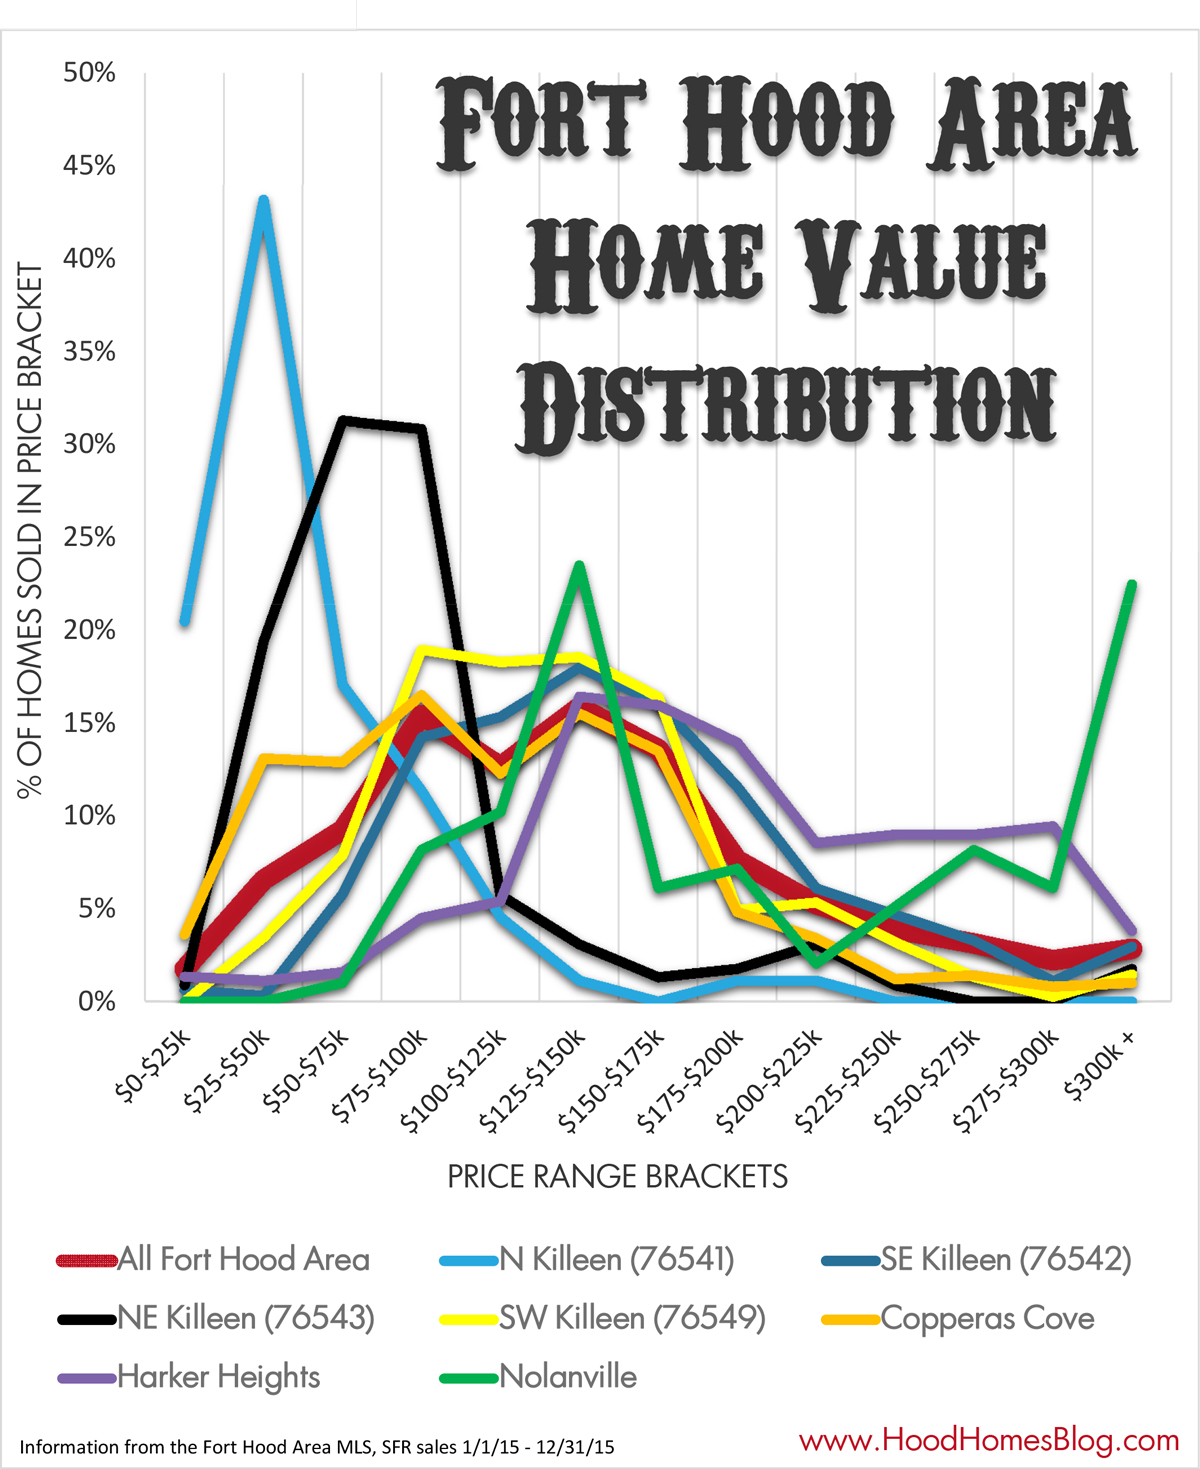
Geographic Price Distribution
Selling a home in 76542 priced around $200,000-$225,000? Only 39 buyers in an entire year purchased in that range. That is not even 4 a month. While your home may justify the price, you will have to be realistic about how many buyers to expect any given month. It may take time.
Selling a home in 76549 priced between $75,000-$100,000? There were 142 buyers in that range in the last year, or nearly 3 a week! That’s more like it. But that also means there are a lot of homes at that price range, too, and you will have to do more work to stand out or even get on the buyer’s top 10 list of homes to see.
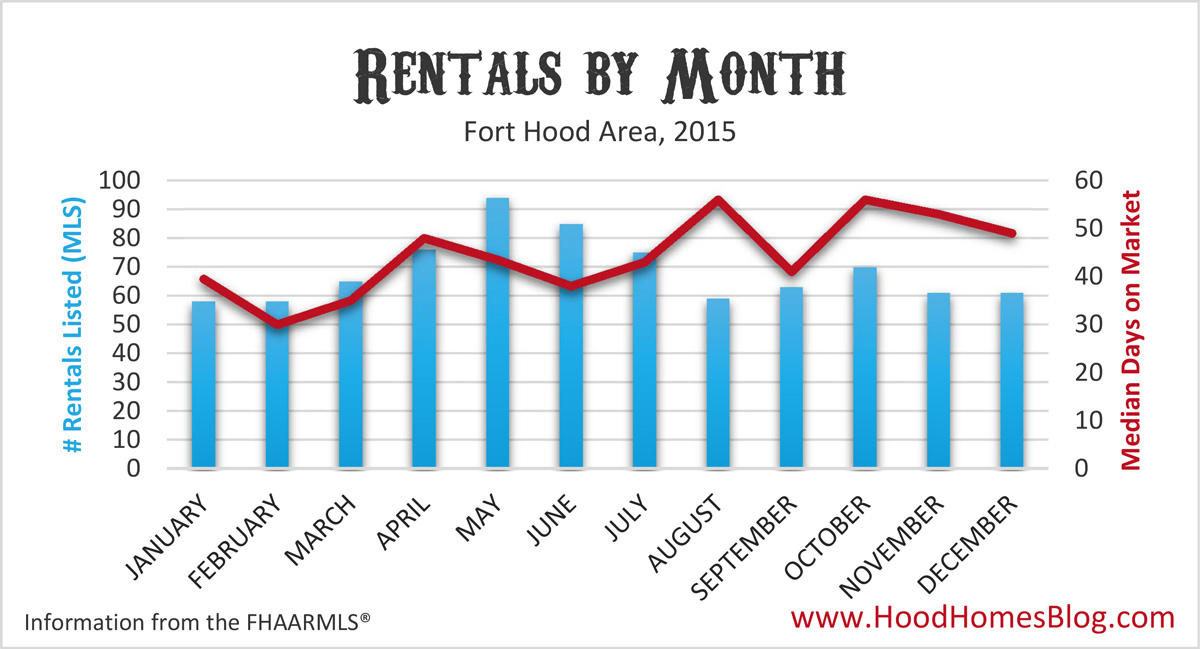
# MLS Rentals by Month
May is the month with the most rentals listed in Fort Hood. – when the turnover starts kicking in. Note that these #s are by the date listed, not leased. Many rentals get listed in May once a tenant submits their 30 day notice, meaning the tenant actually moves probably in June.
Note -the vast majority of Fort Hood rentals are not reflected in these numbers as most property managers do not include them on the MLS.
| JAN | FEB | MAR | APR | MAY | JUN | JUL | AUG | SEP | OCT | NOV | DEC |
|---|---|---|---|---|---|---|---|---|---|---|---|
| 58 | 58 | 65 | 76 | 94 | 85 | 75 | 59 | 73 | 70 | 61 | 61 |
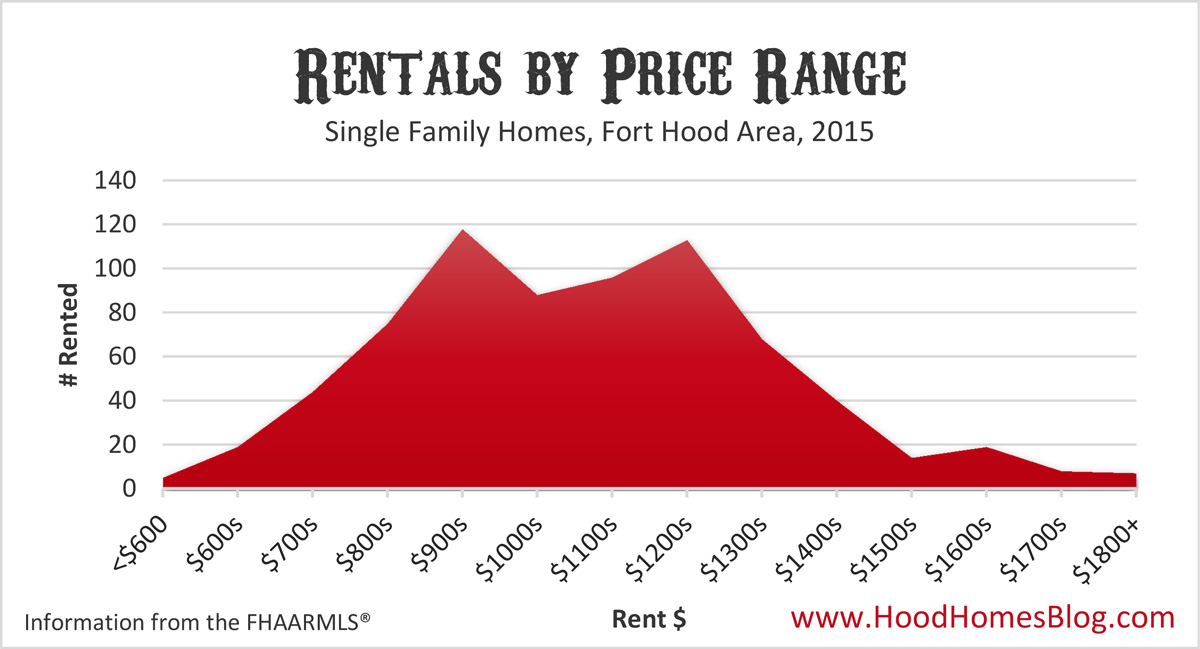
# Rentals by Price Range
For some reason, there is a dip in rentals in the $1000s in the Killeen area. There are lots of rentals in the $900s, and lots in the $1200s, but not as many in between. $900-$1200/mo rent should be your target rent range for buy-and-hold investors.
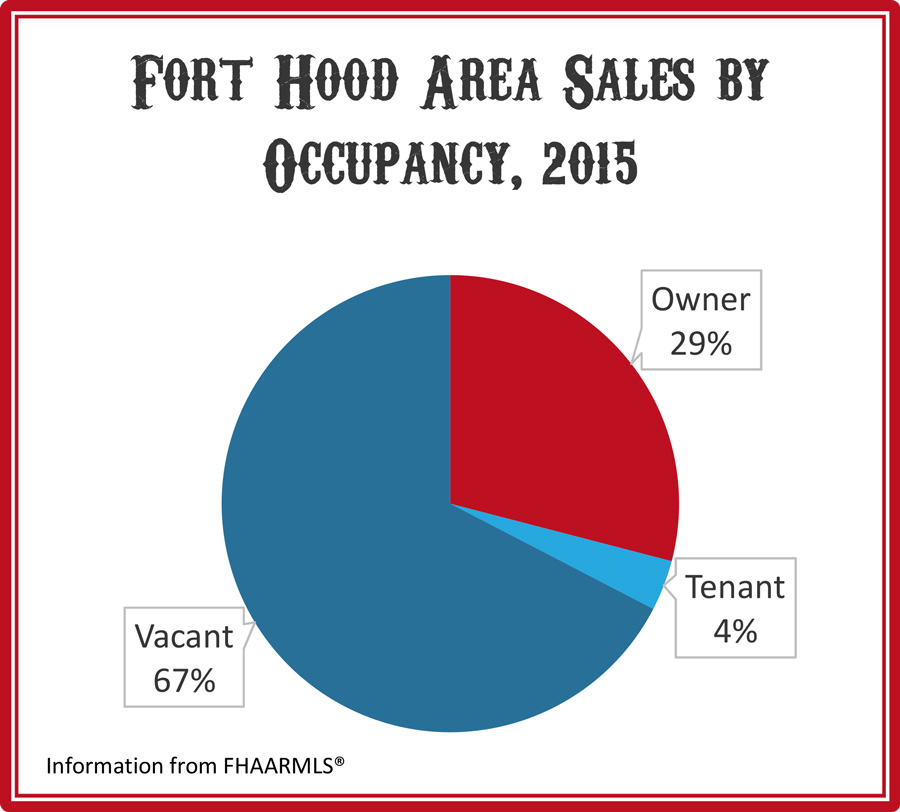
Sales By Occupancy Type
Most homes sold in the Fort Hood area are vacant (about 2/3ds). Working with buyers, it is far easier to schedule and view vacant homes than coordinating showings with the listing agent and seller (or tenant). Alarms, dogs, and messy homes are no fun.
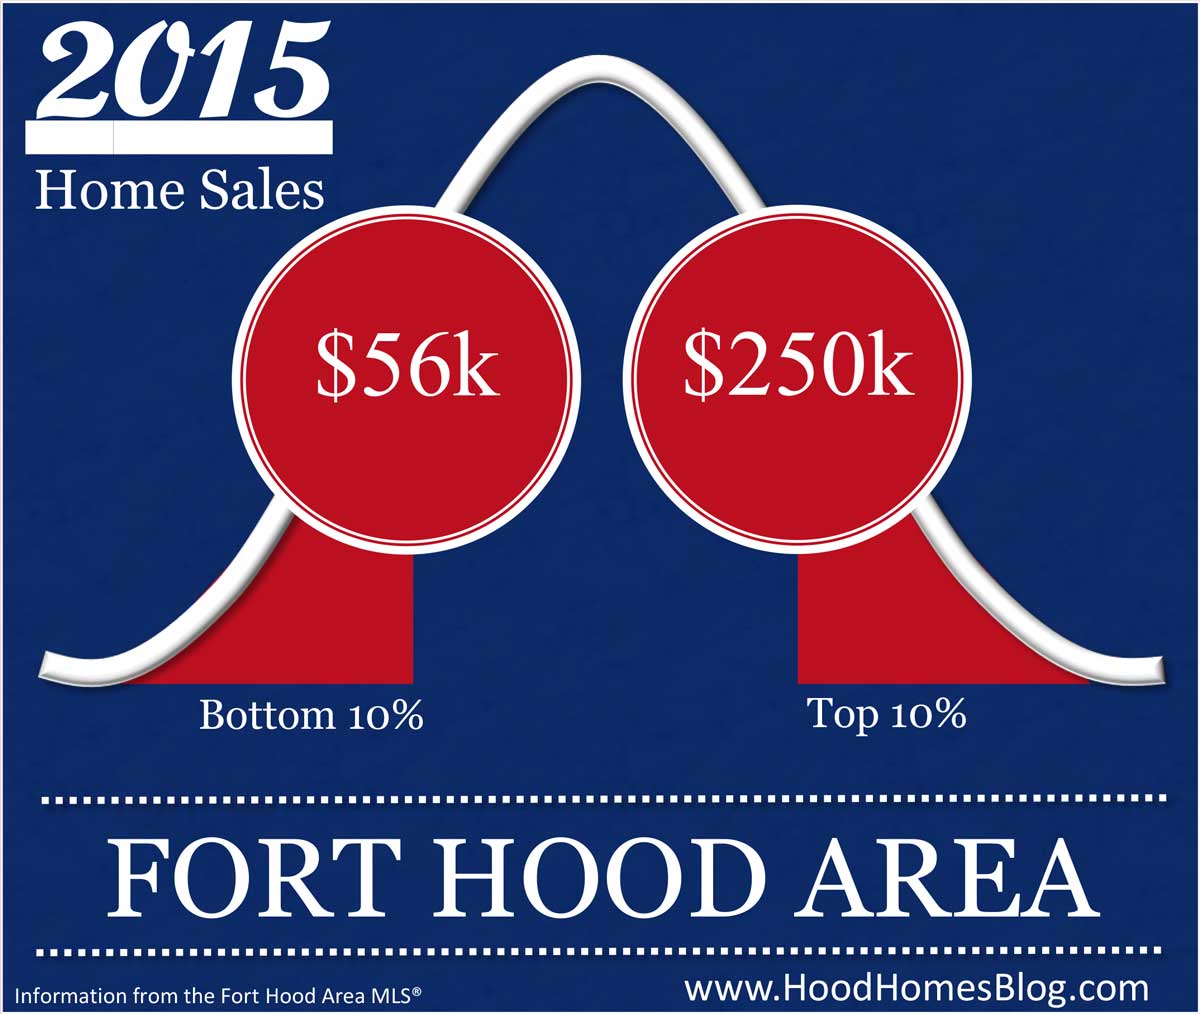
Tail Percentiles
For 2015 sales, the bottom 10% of home sales sold at $56k or less. The top 10% of home sales sold for $250,000 or more.
Often, if considering the resale quality of your home, you probably want to be between these two numbers.
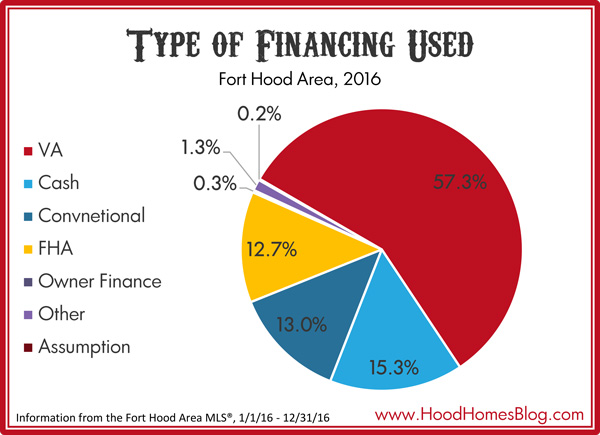
Type of Financing Used
By far, the VA loan is the most prevalent loan type, making up over half of the transactions in the area. The next closest method of payment was cash deals, comprising just 15.3% of the market.
| VA | Cash | Conventional | FHA | Owner Financing | Other | Assumptions |
|---|---|---|---|---|---|---|
| 1854 | 495 | 420 | 411 | 9 | 41 | 5 |
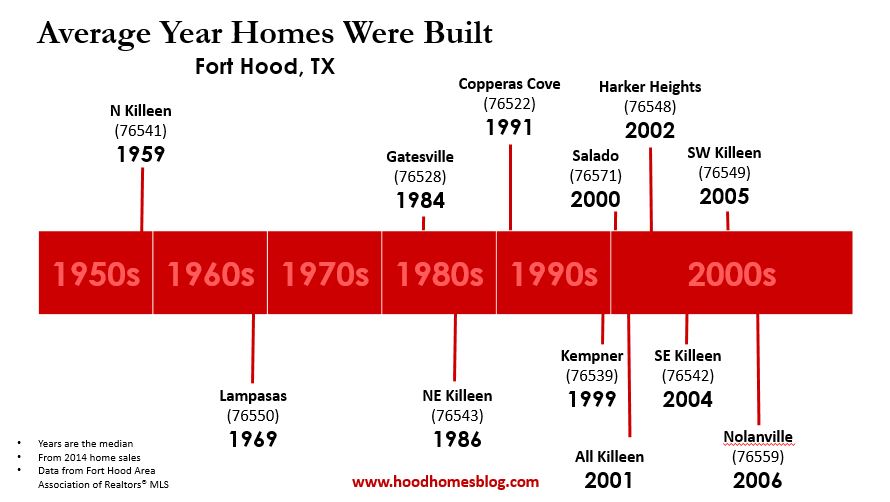
Typical Year Home Was Built
But nevertheless, Killeen is a very “new” area. It’s population in 2000 was a mere 80,000, and the subsequent War on Terror and dramatic expansion of US military forces and the Fort Hood installation swelled Killeen’s numbers to approximately 130,000 today. That is more than a 50% growth in population in 15 years. So it stands to reason that a lot of the housing may have been built since then.
The builders continue, and road work and commercial development continue to make Killeen a growing town. It is likely for a while still, if you live in Killeen, you likely live in a “newer” home.
Market Updates and Articles

Everything You Need to Know About Fort Hood, TX Property Taxes
September 20, 2018

The Fort Hood Real Estate Market in 2018
January 30, 2018

August is Cold - The Seasons of the Fort Hood, TX Housing Market
September 12, 2017
The Average Age of Fort Hood Homes
May 25, 2017

What Happened in Fort Hood's Housing Market in 2016?
February 9, 2017

Fort Hood Housing Market Update - 3rd Quarter, 2016
October 15, 2016
Fort Hood Housing Market Update - 2nd Quarter, 2016
July 10, 2016

Ranking the Best New Home Builders in Fort Hood, TX
June 18, 2016

What to Expect: Renting Out Your Killeen, TX Home
June 10, 2016

You Lose $6,111 If Your Home Doesn't Sell In 1 Month
May 29, 2016
What Happened in the 2015 Fort Hood Housing Market?
January 5, 2016
Where did all the Fort Hood area foreclosures go?
December 30, 2015
Niche Market Articles
The 10 Most "Tree-full" Neighborhoods in Fort Hood
April 5, 2018

Fort Hood Homes For Sale On the Market the Longest
March 21, 2018
Fort Hood Fixer Upper Homes For Sale
March 11, 2018

Fort Hood, TX Homes with a View For Sale
March 1, 2018

Top 10 Neighborhoods For Move-Up Buyers in Fort Hood
February 11, 2018

Top 10 Neighborhoods for First Time Homebuyers in Fort Hood, TX
February 1, 2018

Most Expensive Farms and Ranches For Sale near Fort Hood, TX
January 15, 2018

Top 10 Neighborhoods for Country Living Near Fort Hood, TX
June 16, 2017

Top Waterfront Homes For Sale Near Fort Hood, TX
June 8, 2017

The Cheapest Builder Homes For Sale Near Fort Hood, TX
May 31, 2017

Fort Hood's HUGEST Homes For Sale
May 23, 2017

Best Horse Ranches For Sale in the Fort Hood Area
February 28, 2017