
Takeaways
- Foreclosures fall from 21% to 18% of the market versus the same quarter in 2015
- The price per square foot rises 3% overall versus a year ago
- The market stayed busy unseasonably late, instead of slumping after July like in most years
 Foreclosures Falling
At 18% of home sales, foreclosures are under the previous quarter’s 20% of the market and better than the 21% of the same quarter in 2015. Foreclosures are an endemic part of the Fort Hood landscape, even in an otherwise healthy market, due in large part to the prevalence of the VA loan and builders.
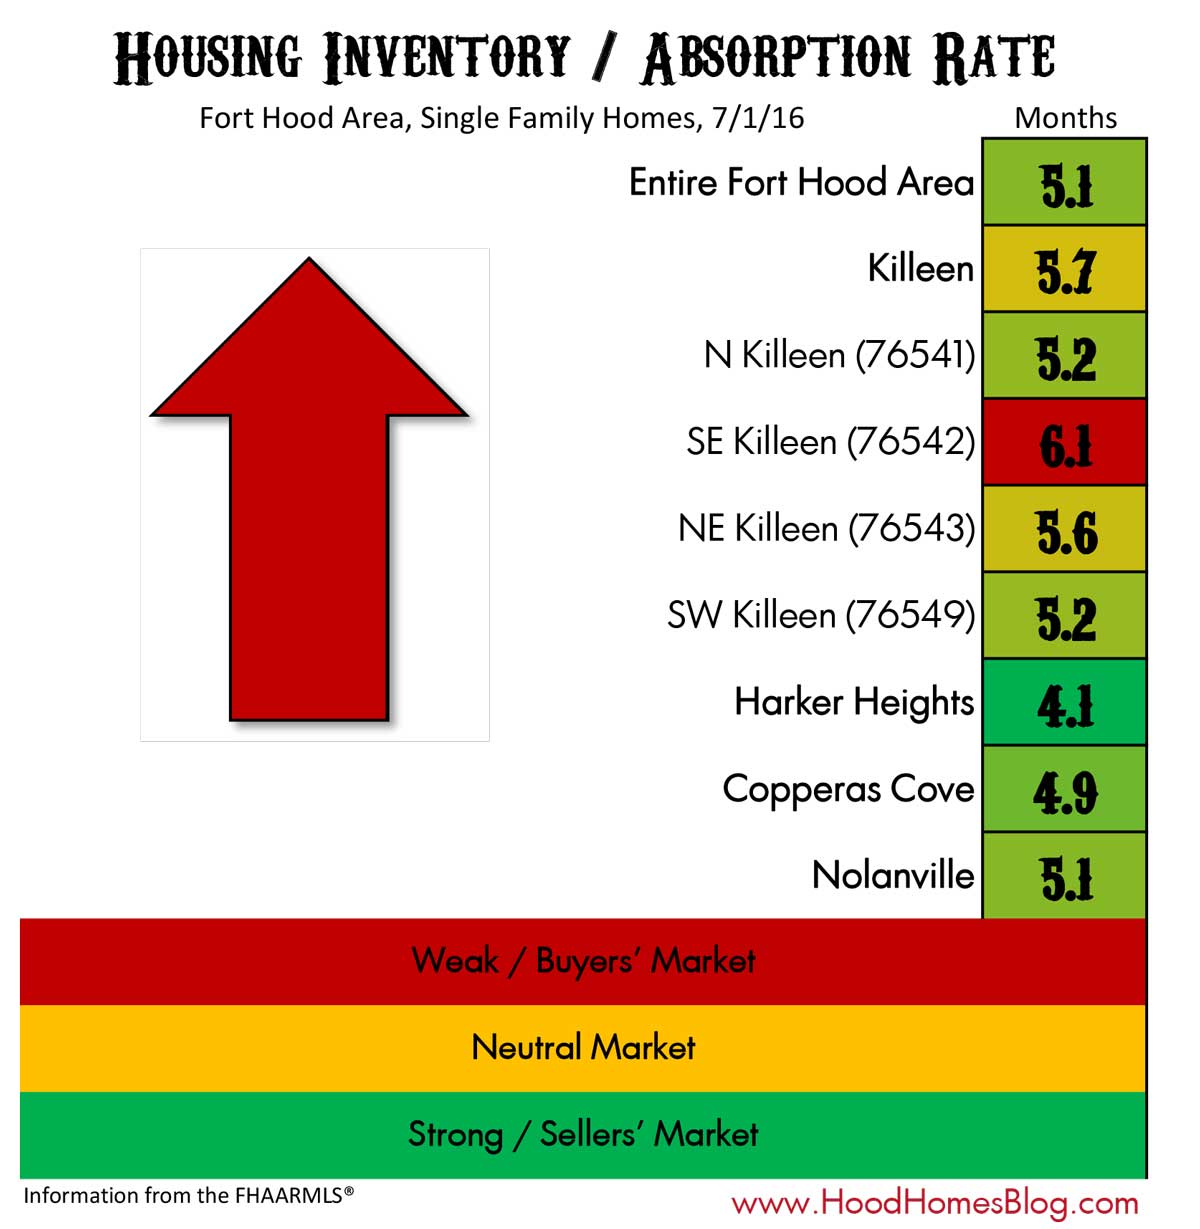
Last quarter, 2nd Quarter 2016, we were excited about the drop in absorption rates under 5 months. Well, that was temporary, as it’s back over 5 months at 5.1 months. That’s okay. There’s nothing wrong with 5.1 months of inventory – something for buyers and sellers alike!
And, by the way, don’t cry for Salado. Their market didn’t “improve” in very many of the metrics we measured, but it was a pretty high bar to live up to. The median price in the same quarter a year ago was a whopping $416,000. That average is more than the most expensive home that sold in most of these other markets. Also, they get knocked half a point for not improving their foreclosure rate. Hard to improve on 0%.
Home Values
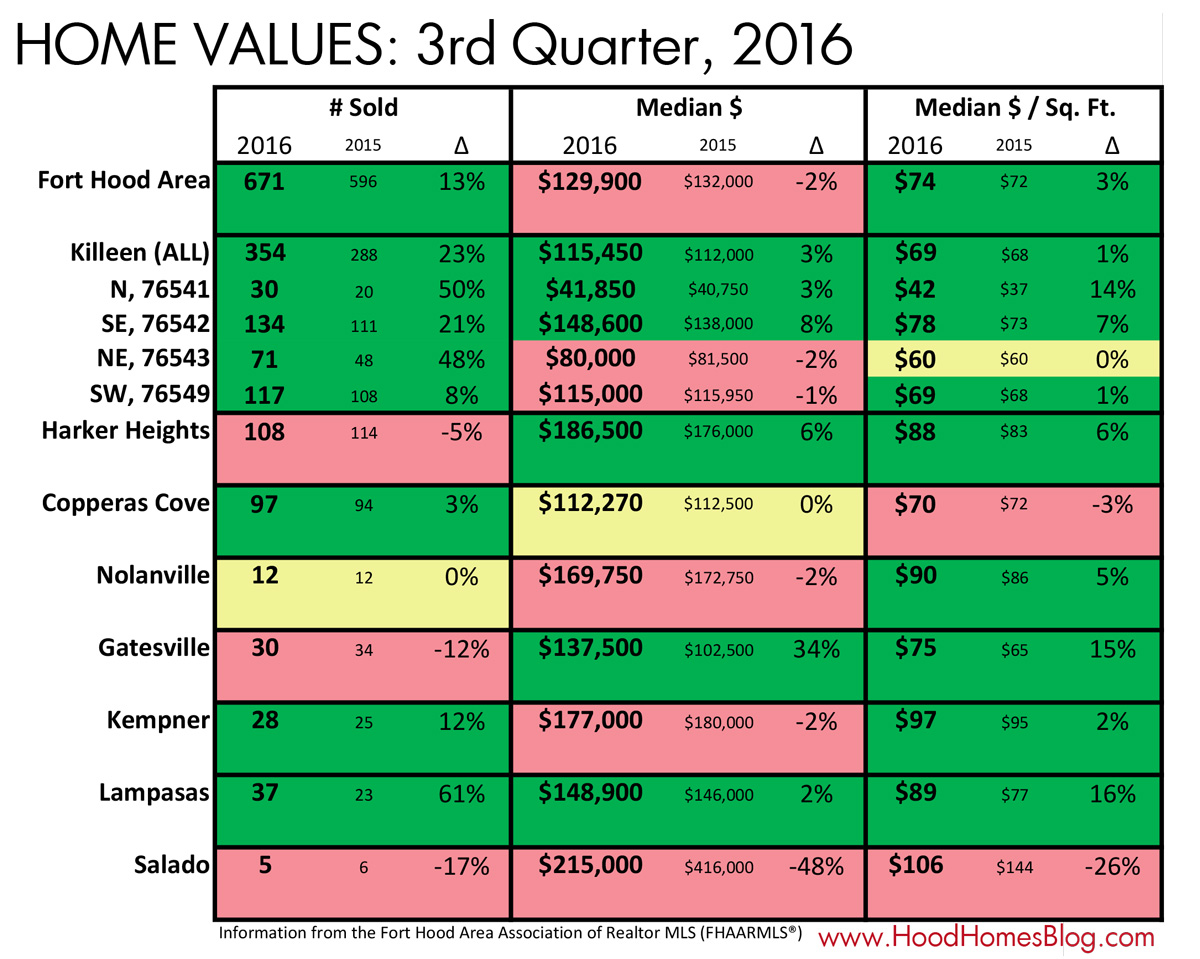
North Killeen’s Revenge!
North Killeen, the ZIP code 76541, had the best quarter of any zip code. That area gets picked on a lot, having by far the lowest median sale price of any Fort Hood zip code. Most improvements were modest. But the 19% foreclosure rate is a whole lot better than the 31% foreclosure rate during the same quarter in 2015.
Price Per Square Feet Doing Great!
The Fort Hood area overall saw a drop in the median price, usually a negative sign. But almost across the board, most areas of Fort Hood saw a rise in the price per square foot of homes sold. How to account for the discrepancy? Possibly just smaller homes selling for more. If I had to choose, higher price per square feet is a better sign than higher median price overall.
Lots and lots and lots and lots…
13% more homes sold this quarter than last quarter. The inventory growth in the Fort Hood area has been tremendous. These numbers only include owner sales – not builders, just as a note. Fort Hood prices may not be skyrocketing like our neighbors to the south in Austin and Williamson County. But the sheer growth in our area has been prodigious nonetheless.
Market Health
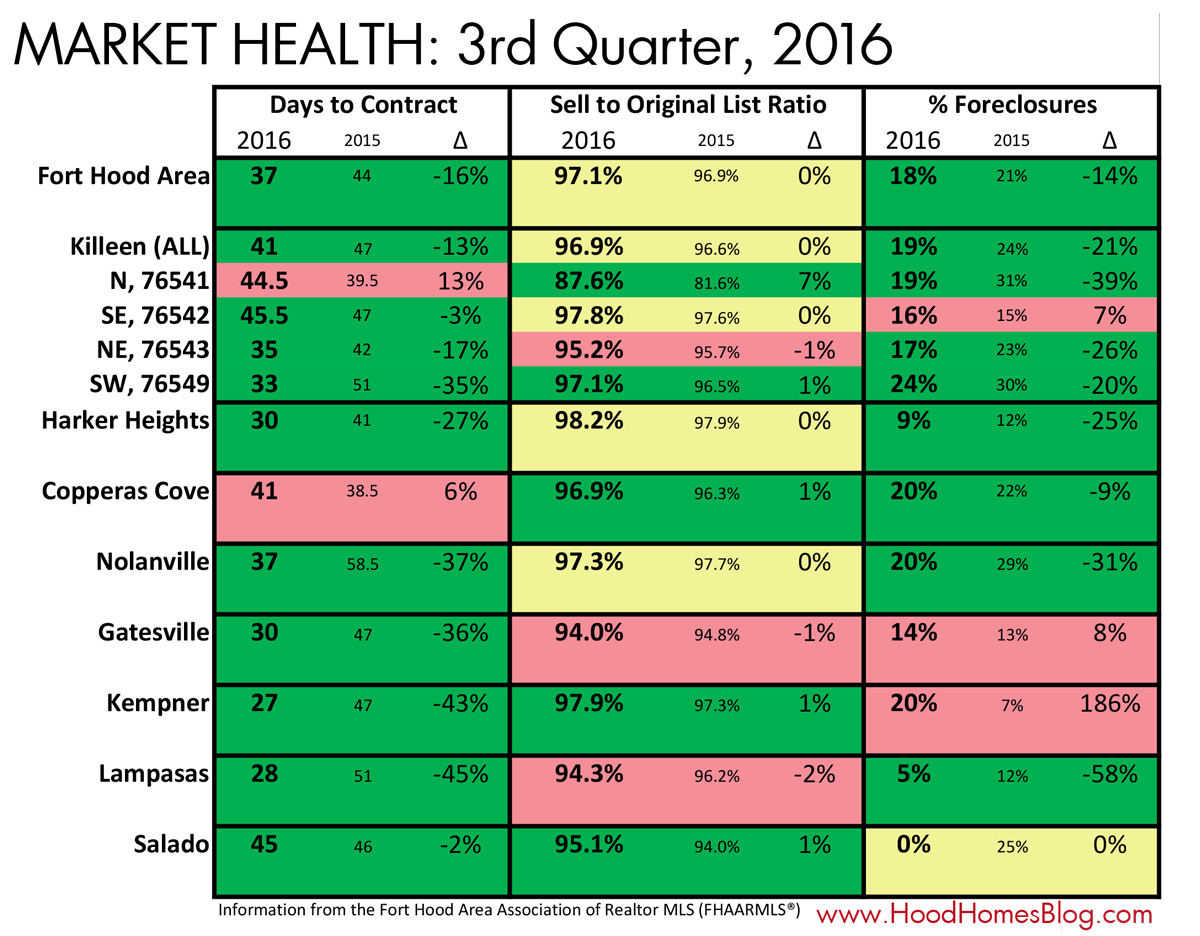
Selling Quickly
Homes went under contract an entire week faster than in the 3rd quarter of 2015. That bit of good news is balanced out a little by the rise in inventory. But still a nice note for sellers on a timeline.
Kempner Gets Foreclosed On
The Fort Hood Area foreclosure rates went down. They went down in spite of Kempner’s 186% increase in foreclosures. 186%! Of course, part of that outlandishly large number is the small sample size in a rural area like Kempner, with 7 foreclosures versus just 1 the same quarter a year ago. Part of the explanation may be the more recent homes built in the area. Newer construction tends to have higher foreclosure rates. Indeed, 5 of the 7 were homes built since 2002.
North Killeen Gets Their Dough
The Sell / List price ratio doesn’t change a lot. But for downtown Killeen – the 76541 ZIP code – home sellers got a lot closer to their asking price than they did a year ago. This may be reflective of home sellers being more reasonable with their initial asking prices, or perhaps the tremendous drop in foreclosures as competition. Or a combination of both.
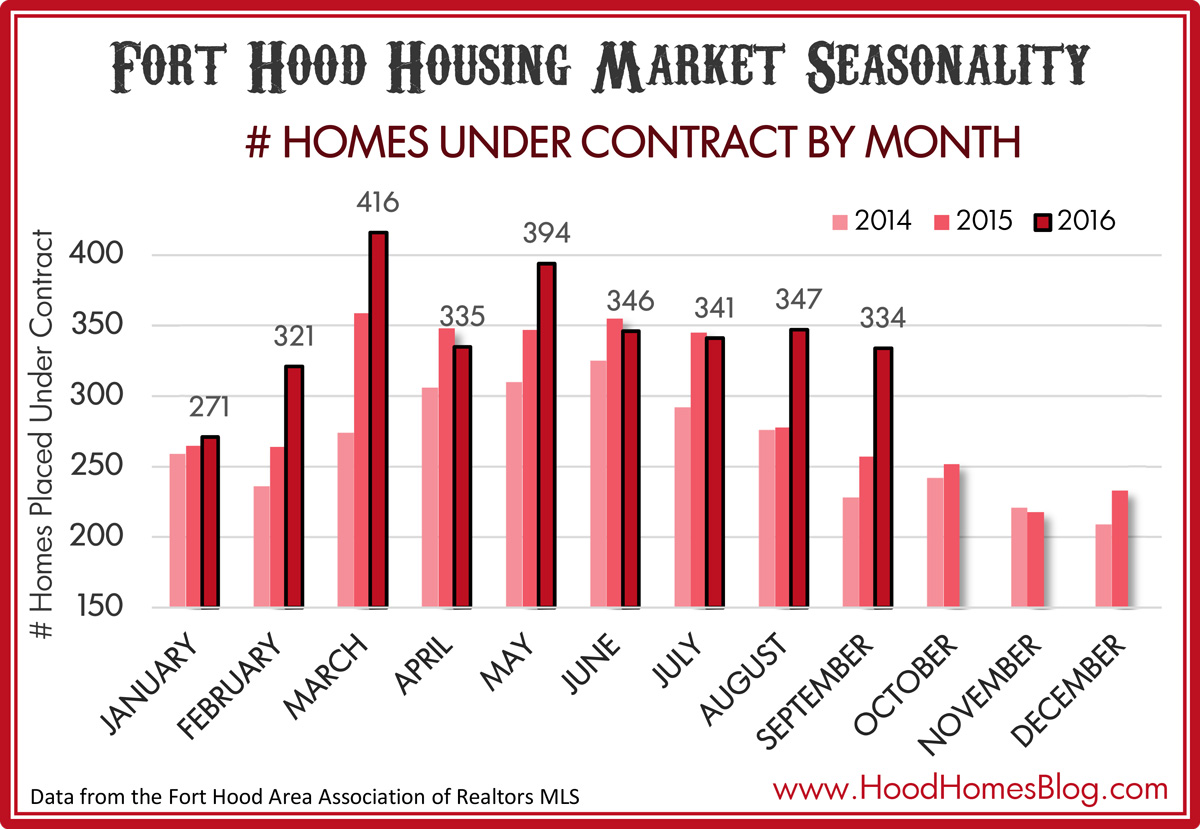
In past years, the housing market started to chill as early as July. In 2016, not only did it keep warm in July, but there is no sign than the chill has set in at all. It’s not the case that inventory is getting eaten up – there is still plenty of inventory as we’ll see below. More homes are just going under contract as more buyers are looking, indiscriminate of the time of year. We’ll see how hard the market may drop in the upcoming winter season.
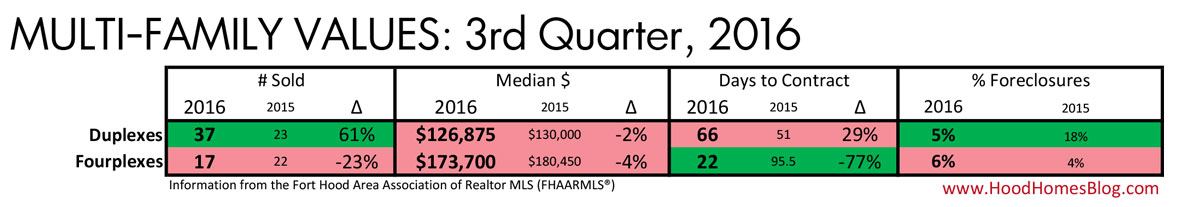
Multi-families continue a rather ho-hum year, with slight drops in the median values versus a year ago. The biggest positive change is the dramatic drop in days on market for fourplexes, from 3 months to less than 1. That demand hasn’t translated into a single positive metric otherwise, but empirically I have observed a lot of interest in Fort Hood area fourplexes. But buyers are still patient for the right prices.
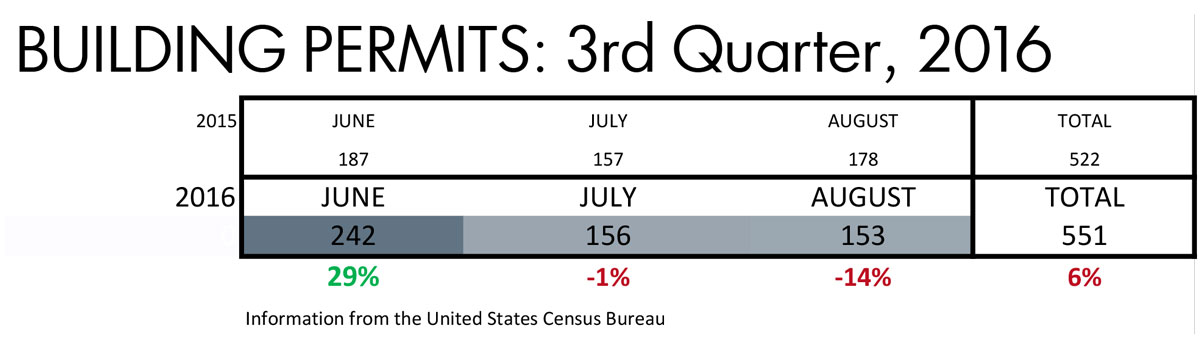
This isn’t exactly the 3rd quarter of the year because the US Census Bureau takes a little while to report their info. Overall, there was a 6% increase in builder permits versys the same period a year ago, spurred by a busy June. The builders aren’t going anywhere!
Last quarter saw a lot of green as inventory dipped. Well, some inventory is back, in spite of homes going under contract faster and later in the season. As sellers, you need to temper your expectations as you have a lot of competition. You will have to compete with a better price, accessibility, condition or exposure.
Conclusion
A mixed report, not unexpected for a “neutral” housing market. There are good signs for each market. The general trends are still set. Harker Heights continues to be one of the top performing communities, and Killeen ain’t nuthin’ to sneeze at, either.