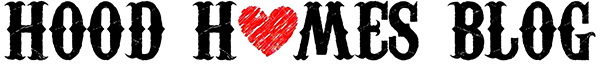
Hood Homes BlogHood Homes Blog

Explore, Learn, Buy, Sell Fort Hood, TX Real Estate

  • Menu
  • Military
    • Budgeting Your BAH
    • The VA Loan
    • The Tex Vet Loan
    • Buyer OPORD
  • Buyers
    • How To Buy a Fort Hood Home
    • Buyer Tool Kit
    • Recommended Lenders
    • Budgeting for a Mortgage
    • Buying Articles
  • Sellers
    • What’s My Home Worth?
    • Seller Tool Kit
    • Guaranteed Quick Sale
    • Recommended Vendors
    • Selling Articles
  • Investors
    • Investor Tool Kit
    • Duplexes/Fourplexes
    • Foreclosures
    • Killeen Investor MeetUp
    • BiggerPockets.com
    • Investing Articles
  • Cities
    • Killeen
    • Harker Heights
    • Copperas Cove
    • Map of Neighborhoods
    • Market Stats
    • Explore Central Texas
  • Blog
    • All Articles
    • Buying
    • Selling
    • Investing
    • Real Estate Industry
    • Fort Hood Living
    • Contracts
  • About Us
    • About Us
    • Contact Us!
    • Real Estate Humor
  • Search by School
  • Builders
  • Foreclosures
  • Map Search
  • Niche Market Search

What Happened in the 2015 Fort Hood Housing Market?

Median Sales Price

Fort Hood area real estate values hit an all time high with a median sales price of $135,000.

Fort Hood Area Median Sales Price Trends

Inventory

As of 1/1/16, the inventory has dropped still further to 5.3 months, trending dangerously close to a seller’s market, though it still behaves as a buyer’s market.

Median List to Sell Ratio

What percent of the original list price do homes usually sell for? Foreclosures actually sell closer to the original list price because their price usually is already dramatically discounted.

96.7% for Owner Sales

98.0% for Foreclosure Sales

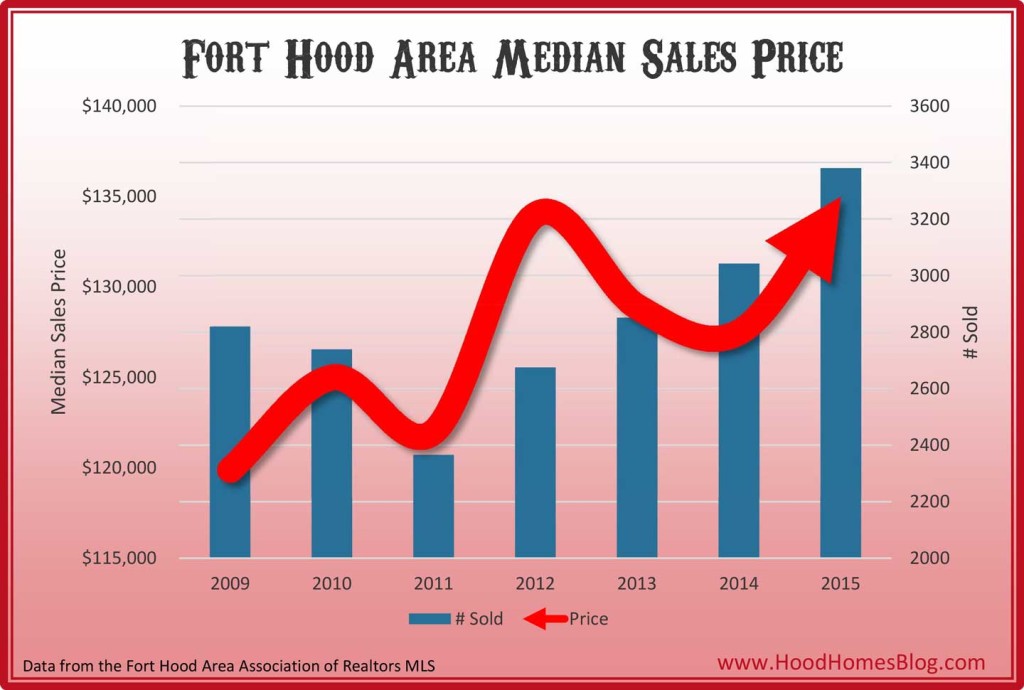
Geographic Home Value Distribution

The chart below shows, by region, the percentage of homes sold in each $25,000 price range.  For example, over 40% of homes sold in N Killeen (76541) were between $25,000 and $50,000.  Using this graph you can grasp what kind of price ranges comprise each market.  Killeen is divided by ZIP Code.
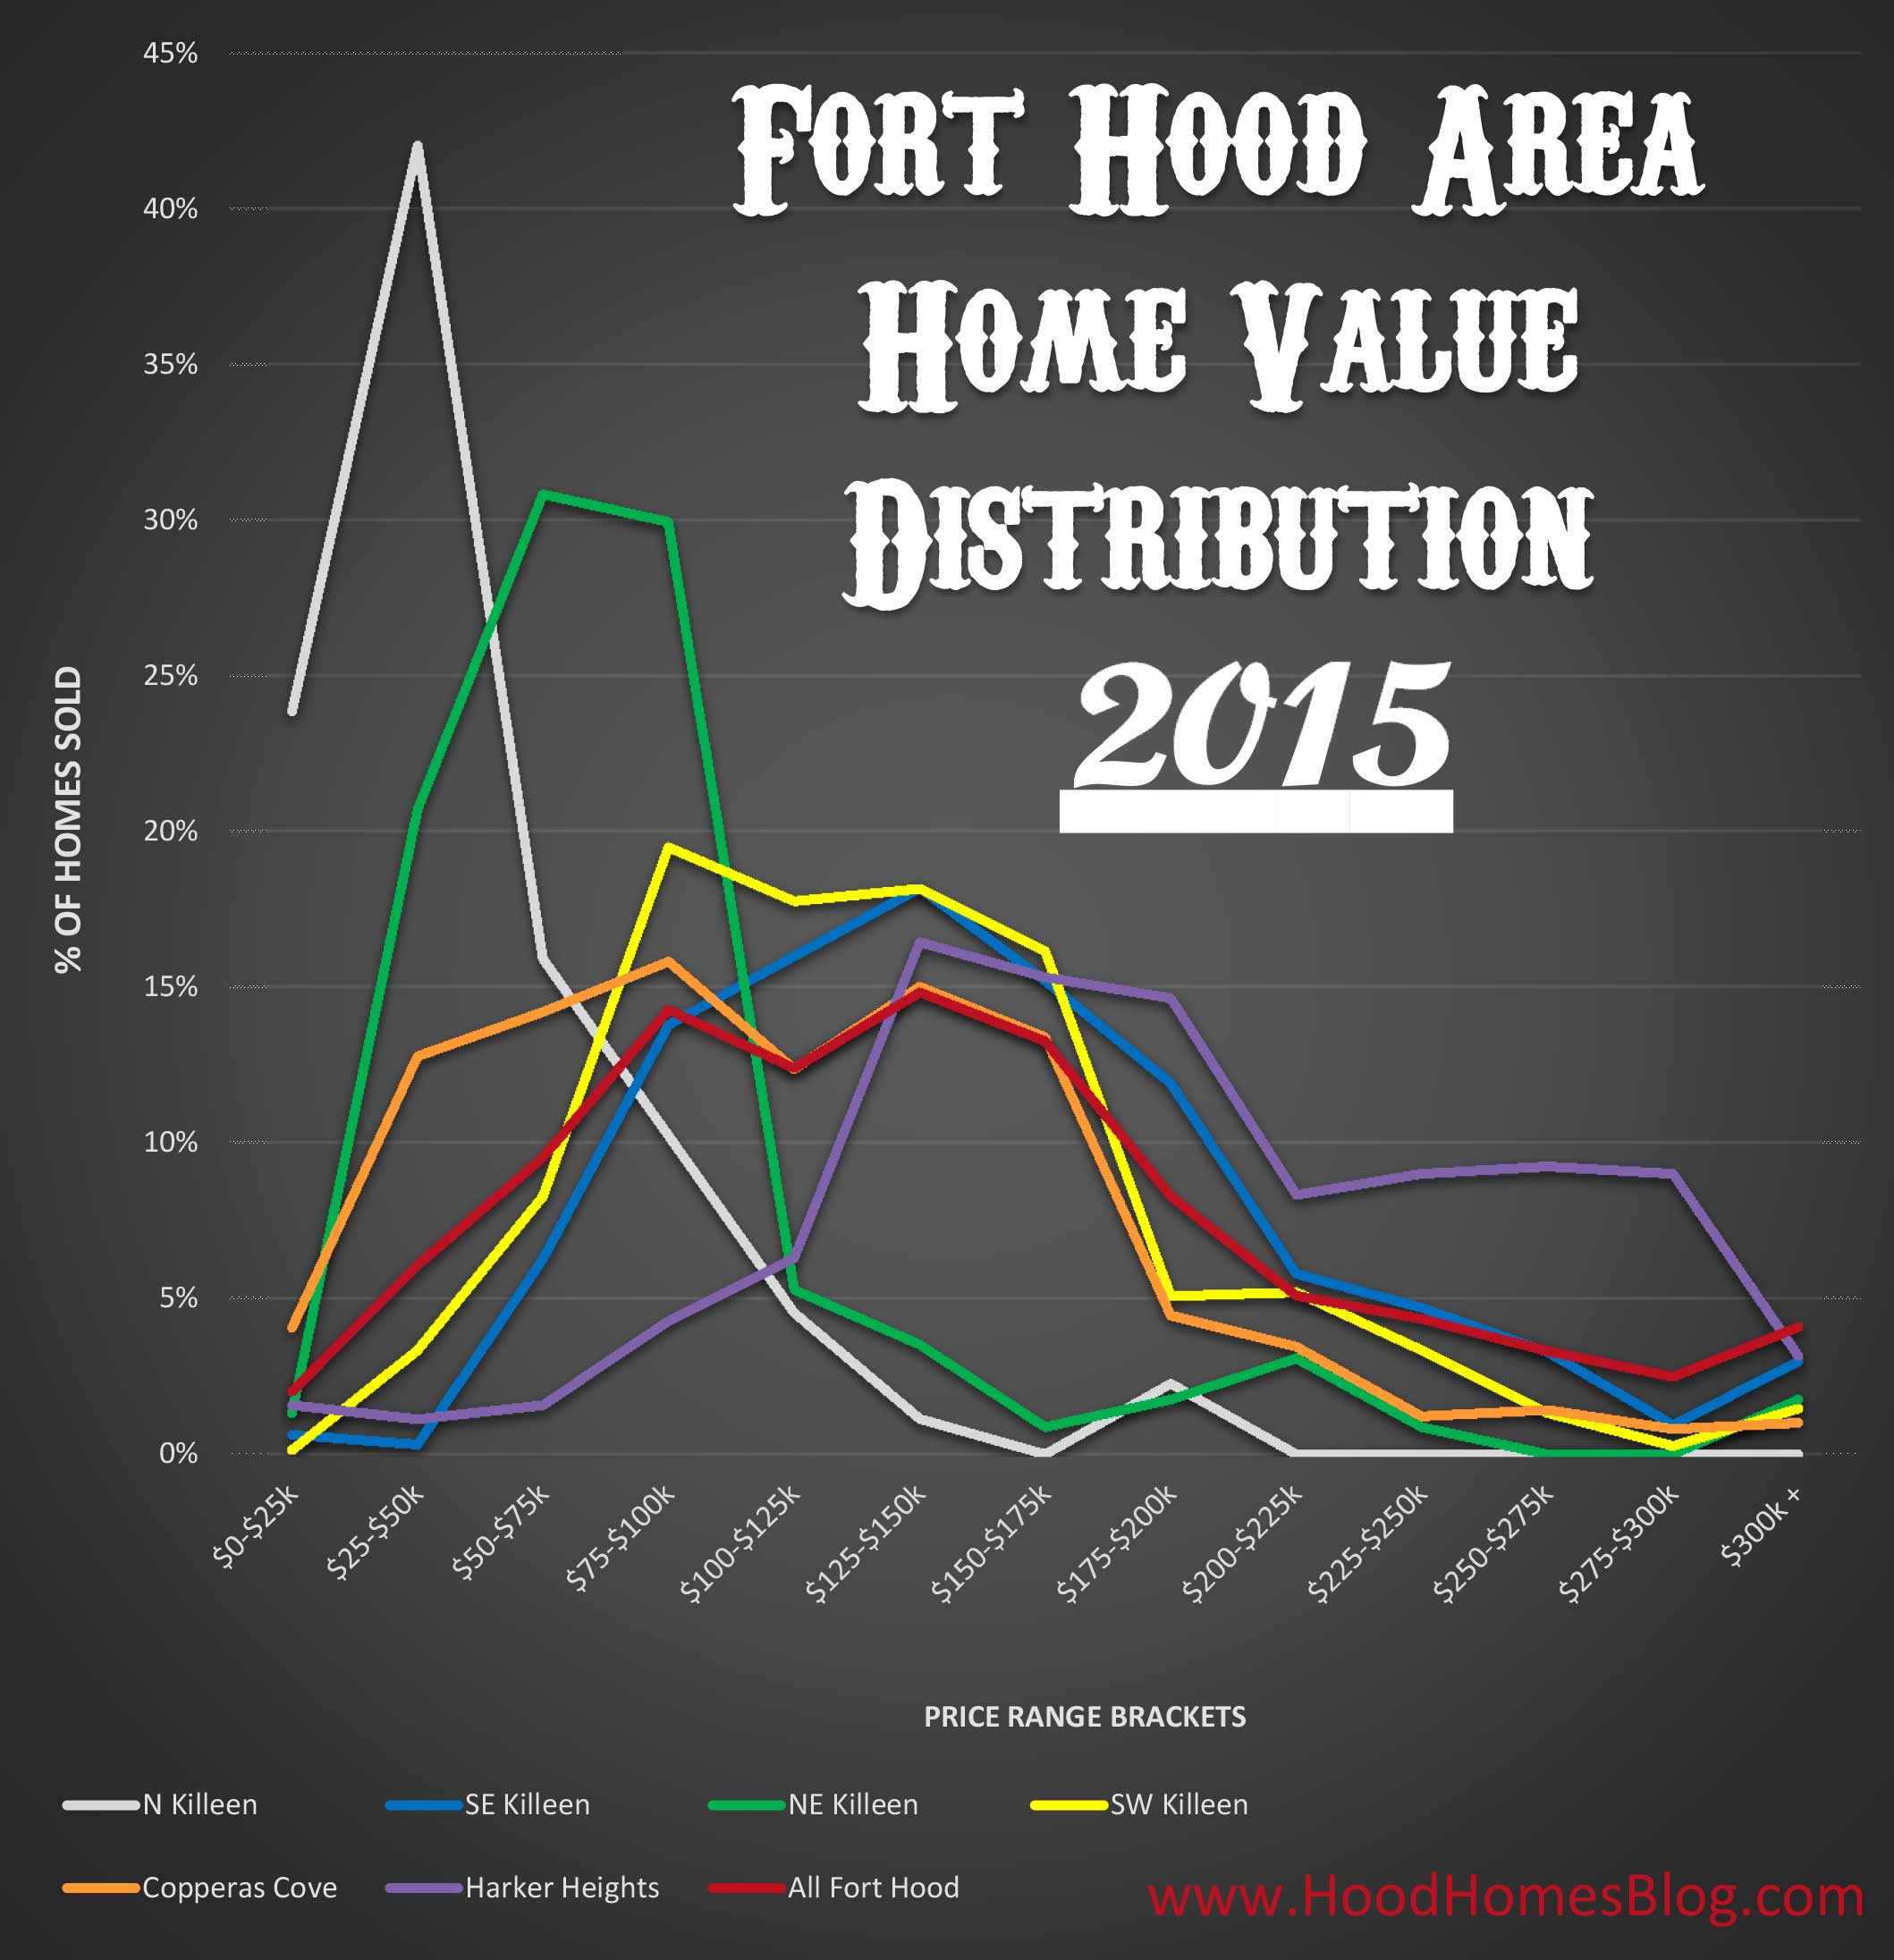
Fort Hood Area Home Price Geographic Distribution

Market Seasonality

No surprise, March – July are hot months for homes going under contract – good for sellers, bad for buyers.

Fort Hood Area Home Sales by Month

Killeen – Harker Heights – Copperas Cove Home Value Trends
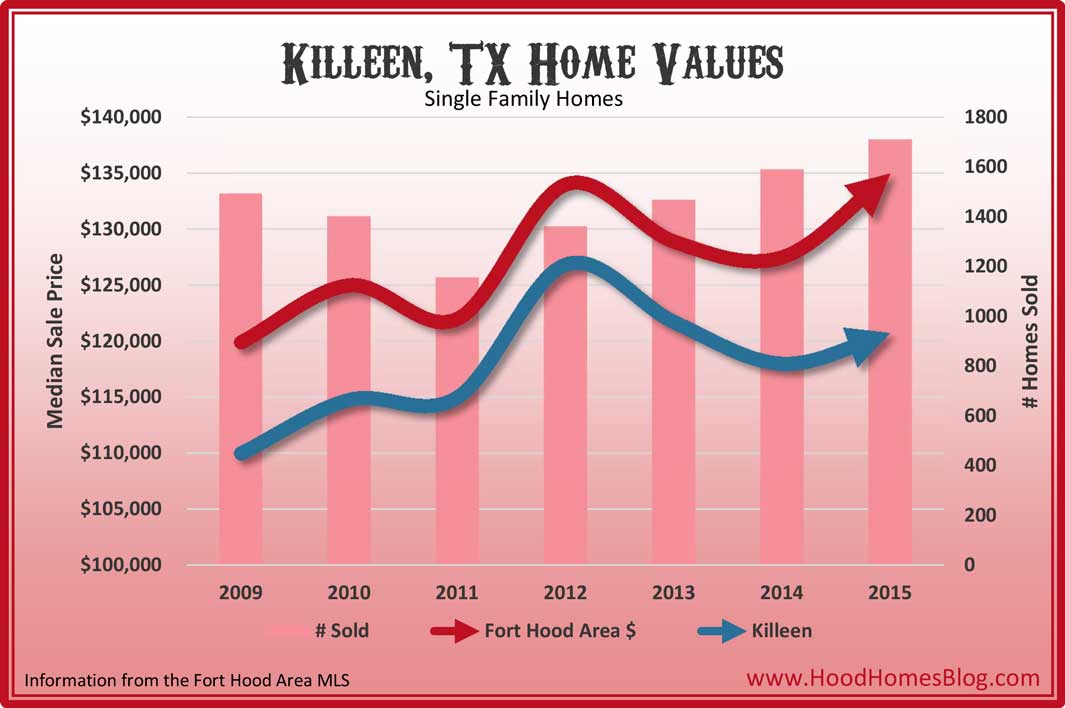
Killeen Home Values

Median: $120,750

Days on Market: 119

# Sold: 1710

% Foreclosures: 19.5%
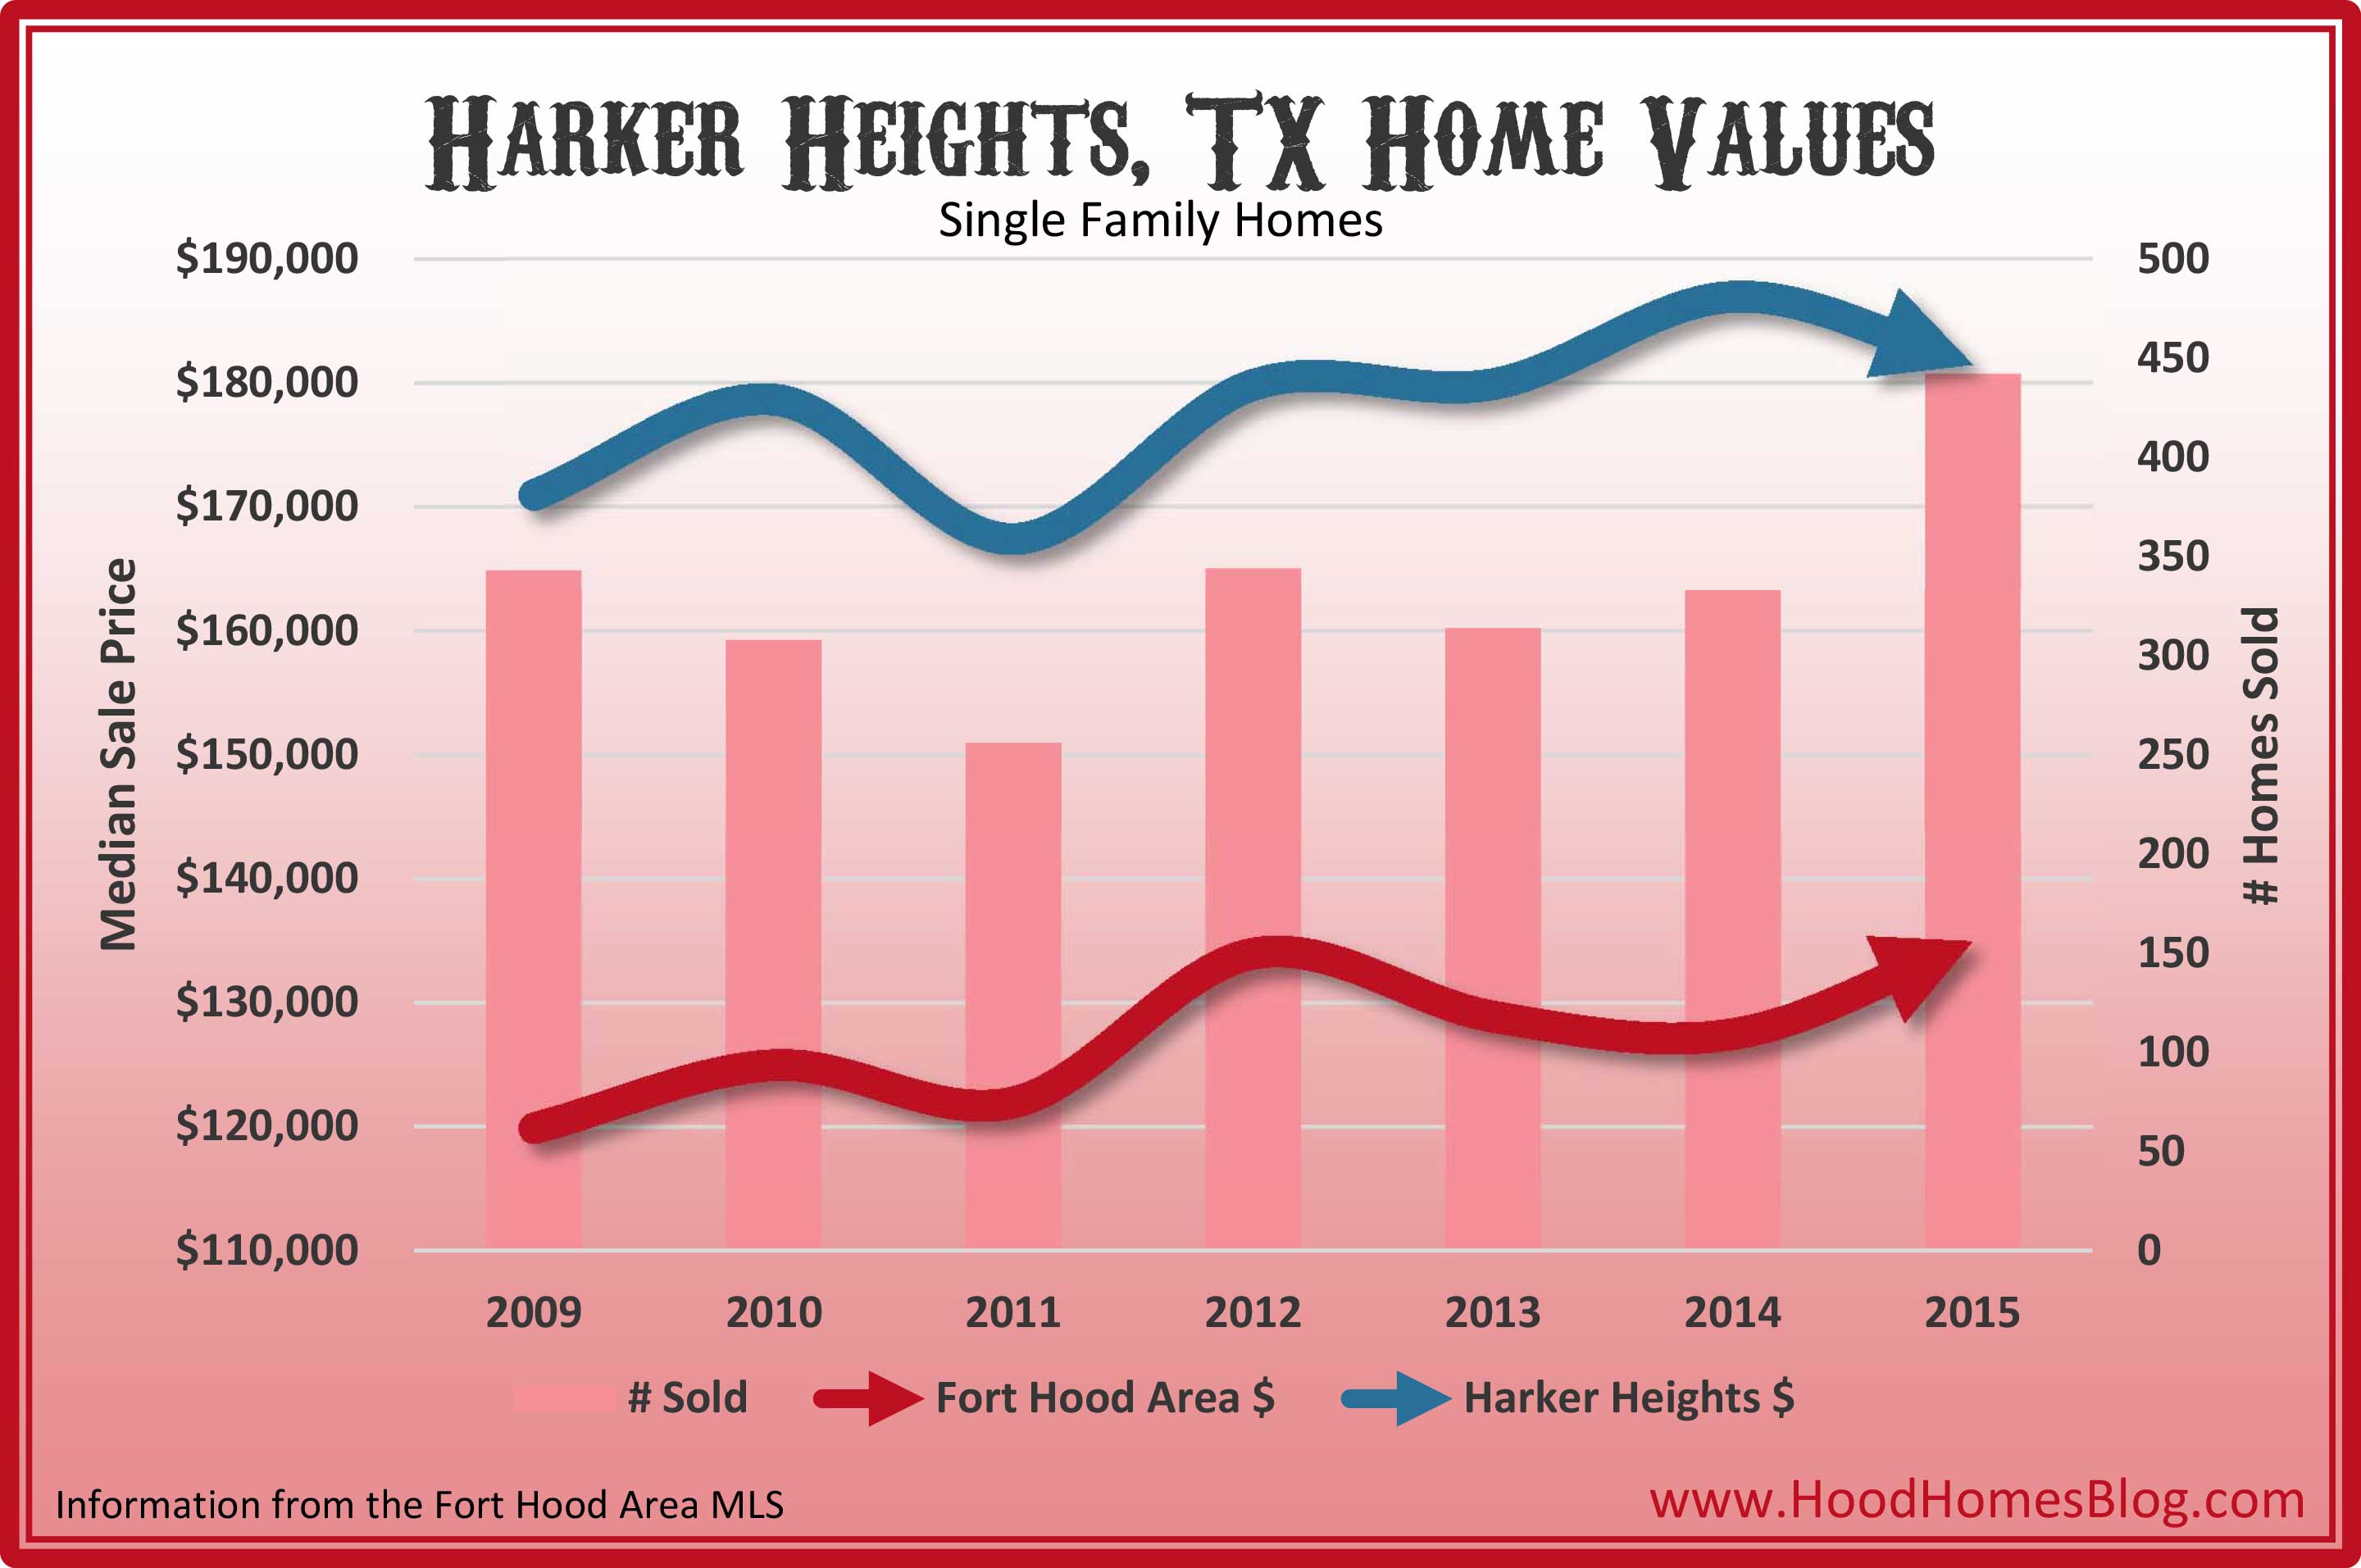
 

Harker Heights Home Values

Median: $181,500

Days on Market: 128

# Sold: 442

% Foreclosures: 9.7%
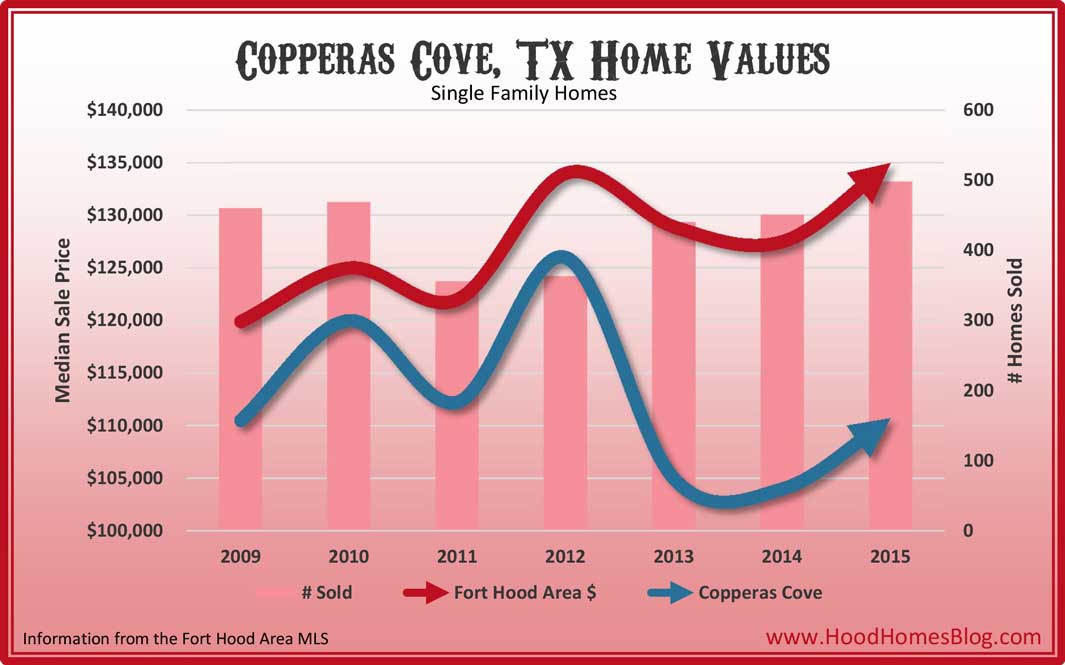
 

Copperas Cove Home Values

Median: $110,750

Days on Market: 114

# Sold: 498

% Foreclosures: 19.1%


Posted in: Market Tagged: copperas cove, Days on Market, foreclosures, harker heights, killeen, months of inventory

Post navigation

« Where did all the Fort Hood area foreclosures go?
54% of Fort Hood Home Buyers Used the VA Loan in 2015 »
Request a Home Valuation
Read the Buyer Guide

Find Homes

Brian E Adams, Realtor

Brian E Adams, Realtor, GRI
StarPointe Realty
1604 South W S Young Drive
Killeen, TX 76543
(512) 763-7912
brian@hoodhomesblog.com
Licensed in the State of Texas


TREC CONSUMER PROTECTION NOTICE TREC INFORMATION ABOUT BROKERAGE SERVICES
Hood Homes Blog Privacy Policy

Search the Site!

Search for:
© 2025 · Equity Framework
Log in